Why Use Lower Time Frames For Entry Locations

When trading higher time frame charts, having a lower time frame chart open when price is evolving from a price pattern makes sense. I’ve talked about this many times in blog posts and in my weekly setups.
For examples, when trading pullbacks, there are a few ways to find an entry.
- You can enter on the break of a counter trend trend line
- You can enter when price is rejected from a support or resistance zone
You can certainly do that on the trading chart but if your trading chart is a daily or higher, there are times where you will be late on the move especially if you enter near the close – in Forex, near the end of the London or U.S. trading session.
That is why I’ve routinely mentioned using lower time frames to find an entry.
For this week, let’s take a look at the USDCAD Forex chart that I posted. We were looking at trading the resolution of a pullback to the long side. Keep in mind that due to the nature of how these charts are presented every week, it’s impossible to post how to react to every situation.
Your job is to take the information that I post every week and put it together into a sensible trading approach for yourself.

This is the four hour chart of the USDCAD with the daily chart in the left. You can see we were working with a pullback and wanted an entry long.
On the four hour chart, it was easy to see the location of a downwards trend line and by themselves, trend line breaks may or may not have an edge. I’ve never tested it but my guess would be no.
There is no edge.
It’s a line on a chart.
But in the context of a normal market movement – a pullback in price – we can use the trend line break to show that something has changed in the rhythm of the market.
That change can equal a trade entry.
Not a trade entry for a trend line break trade but a trade entry for a pullback resolution.
In the case of this setup, price broke what people consider a “resistance trend line” and price hovered at the extreme. That is bullish price action and a trade entry.
The lower you go in time frames, the more swings you will see where you can draw your trend line. My general trend line drawing rule: ensure you have connected the last high (or low) before the new low (or high).
Using Breaks Of Pullback Symmetry
Another way you can enter these types of trades is to look on the lower time frame for pullbacks that are against the higher time frame trend.
As an example, in the USDCAD, our daily chart gives us a long side look. During the daily pullback, the lower time frames are actually making lower lows and lower highs which is a down trend.

My lower time frame is four hour but went to the 2 hour chart so you can better see the pullbacks in the down trend. They are visible on the four hour but for example clarity, I am using this chart.
By measuring the distance of the last 1 or 2 pullbacks and projecting that distance from the low of the overall move, you can actually set your buy stop order at one of those prices.
What this does is get you into the move when the rhythm of the down trending move breaks as the pullback off the bottom begins to exceed the prior ones. This could be a set and forget trade but I think that type of trading is silly.
Set And Forget Trading Is Silly
Why is set and forget trading silly?
While it may appeal to some people and does have the advantage of keeping you from making emotional decisions, price action rules.
Often times price action will show strong moves against you and it makes no sense to “forget” the trade and let your initial stop get hit.

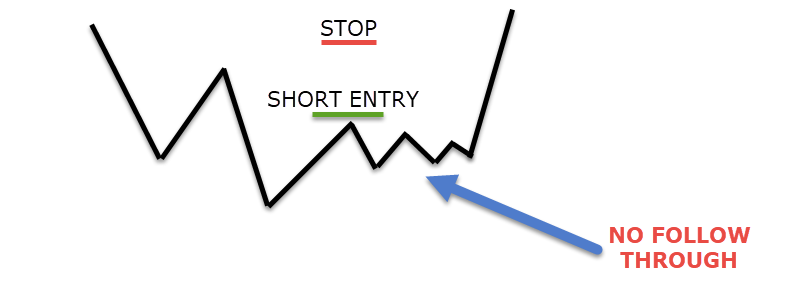
After entering a pullback trade in the direction of the trend, there is no follow through of price.
Price is even making higher lows into resistance which is a sign that your pullback trade is failing. There would be no need to take a full stop out on that type of action.
- You could exit the trade and bank small profits
- You could tighten the stop to reduce risk
You must do something!
Summary
You can see that lower time frame trade entries into a higher time frame trading pattern makes sense. The key is to ensure your stop location is in line with the higher time frame chart. You are using the lower to simply gain a better trade entry.
Set and forget trading may sound appealing but it is a lazy way to trade and an easy way to lose money when you don’t have to.
Be smart! – Please share


