Forex Trend Flex is a traditional trend indicator based on moving averages. You can use the tool as a primary strategy or to confirm market bias. In both cases, the tool provides easier interpretation and is convenient to use.
How to use Trend Flex
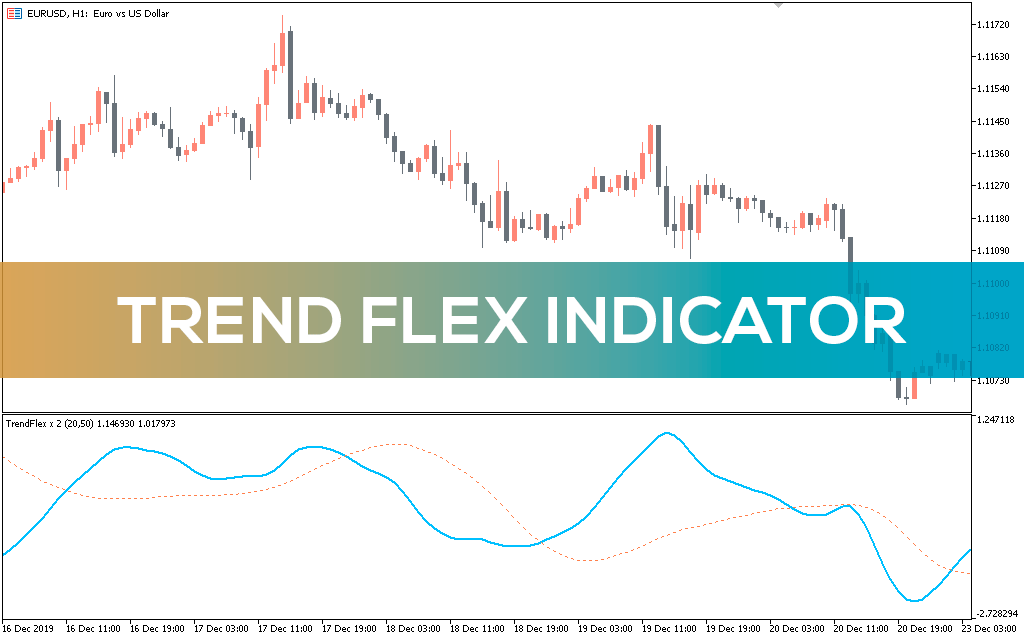
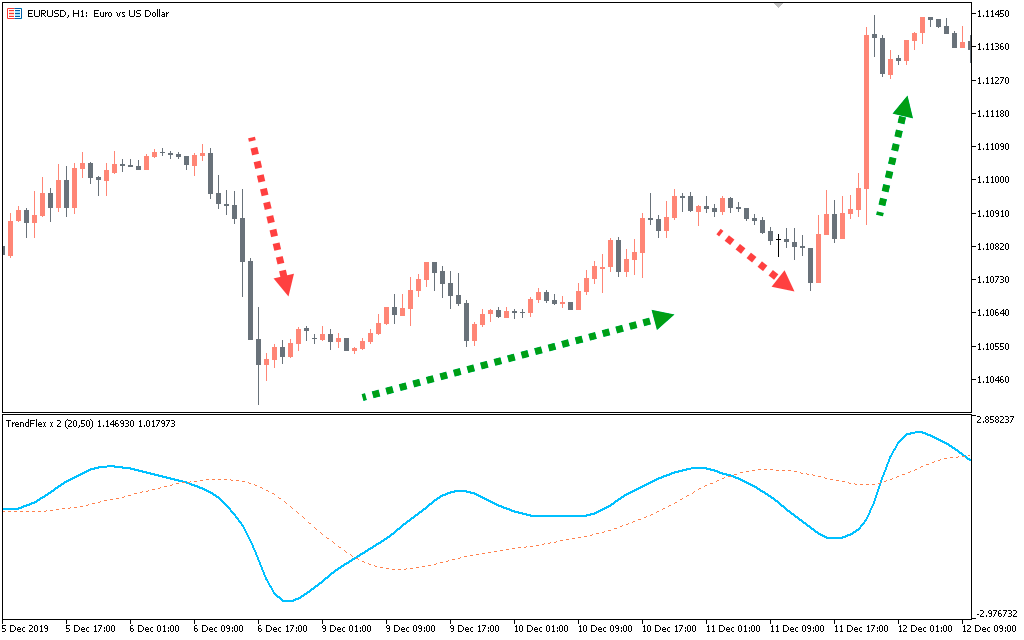
The indicator helps to analyze the continuation and reversal of a trend.
The blue line shows fast speed and the orange doted dotted line shows slow speed. The intersection of both lines represents a trading opportunity.
When the blue line crosses the orange doted line, it is a potential long opportunity. On the other hand, if the blue line crosses the orange doted line, it is a potential selling opportunity. Moreover, the gap between both lines reflects the strength of the trend. The wider the gap, the stronger the trend. Closer lines indicate market consolidation.
Setting
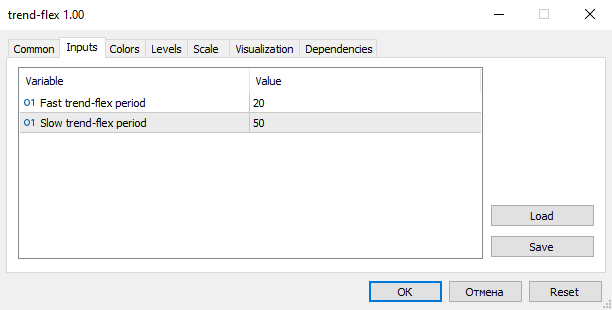
Fast trend-flex period: Default value is 20. You can decrease the number for an aggressive approach.
Slow trend-flex period: Default value is 50. Increasing the number will make it conservative and vice versa.
Conclusion
The Trend Flex indicator gives you an idea of whether the price is trending, consolidating or reversing. The indicator lags, and some signals may be false. It is better to use it on wider timeframes. Be smart and test the demo version with different timeframes and assets to get a good understanding of the instrument before trying it on real funds.