The Tmagi indicator is a moving average trend analysis tool designed for MT5 platforms. It uses the intersection of the fast and slow MA to determine market bias. Additionally, it uses simple and linear weighted moving averages to check the validity of the price trend.
Technically, Magi has the ability to filter out false signals by cross-checking market momentum. Additionally, it automatically adjusts to MTF charts, allowing you to check trend conditions on different timeframes.
This article is an in-depth review of the Tmagi indicator, showing how it works on MT5, with example charts.
How the Tmagi Indicator Determines Buy-Sell Signals in MT5

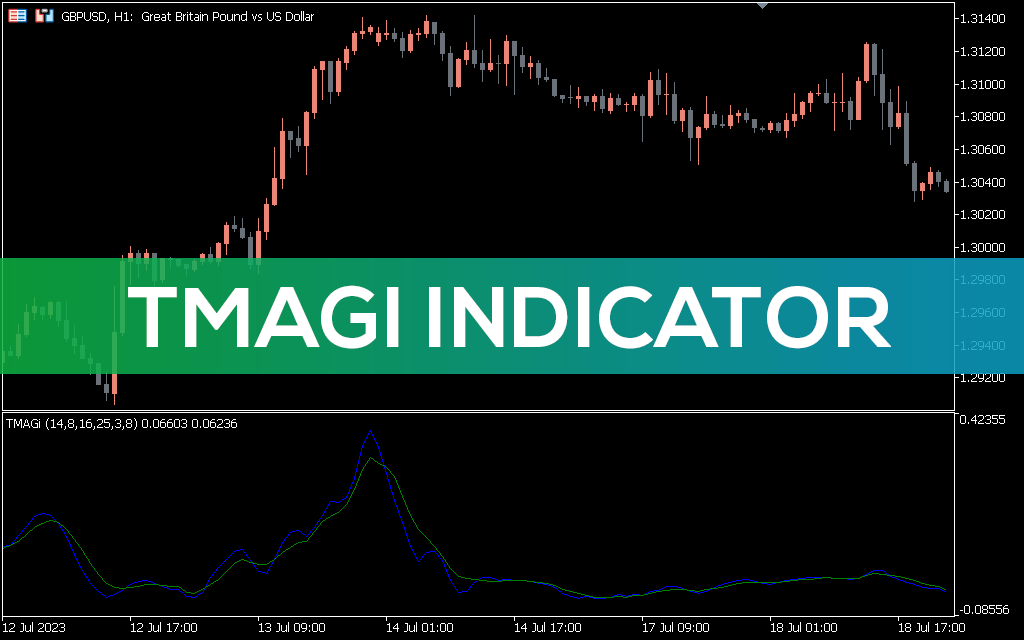
The Tmagi indicator shows fast and slow averages in blue and green. The fast MA exceeding the slow MA indicates a bullish crossover. Conversely, the slow MA moves above the fast MA, signaling a bearish crossover.
To further confirm the market trend, monitor whether the moving averages are holding above or below the zero line. For example, only consider a buy entry if a bullish crossover occurs and both moving averages remain above the horizontal level.
In the 1-hour EUR/USD chart above, the Tmagi indicator generated a bearish crossover signal as the price broke above trendline support. Later, when both moving averages fell below the zero line, we confirmed that this was a valid sell setup consistent with a bearish market trend.
Setting
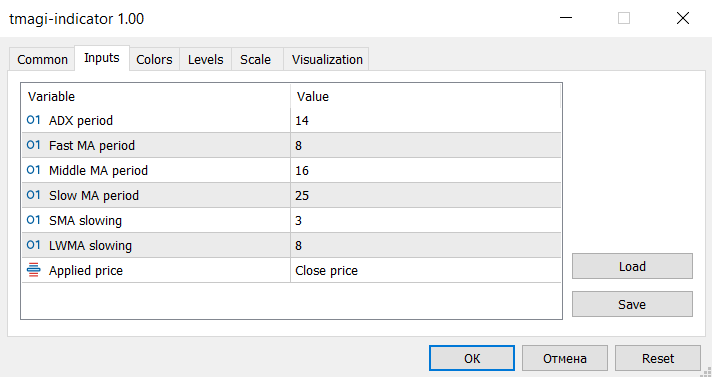
Fast MA: Input the fast MA period.
Mid-MA: The Mid MA smooths the price average and is used to equalize the signal frequency.
Slow MA: Input the slow MA period.
Slowing SMA: Set the slowing simple moving average period.
Slowing LWMA: Set the linear weighted moving average period.
Conclusion
In conclusion, if you are looking for an MT5 indicator that will help you do scalping and day trading at the same time, then Tmagi may be the best choice. It is easy to use, easy to configure and provides real-time trend signals. We recommend you try it with support/resistance and trendlines to increase your winnings.