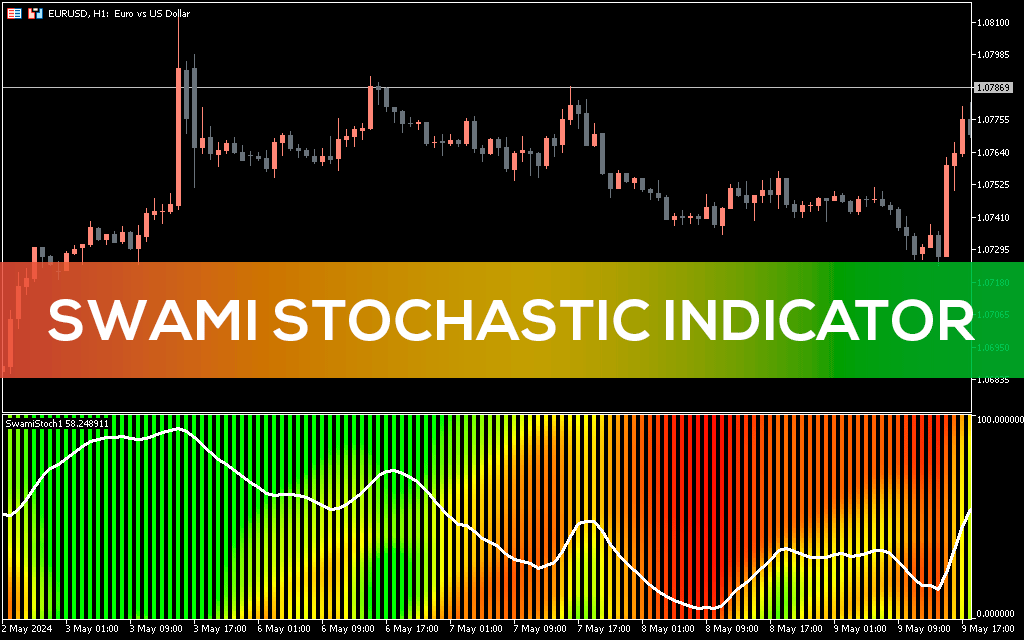
The Swami Stochastic indicator for MT5 provides oversold and overbought trading signals. Additionally, it provides a heat map that clearly distinguishes between bullish and bearish market conditions. This way, technical forex traders can easily determine the market trend status and the best entry points.
The indicator works well on all chart timeframes. Moreover, it is effective for new and experienced Forex traders. Although the indicator works well in most market conditions, reversal trading signals may not be effective during a strong trend.
Swami Stochastic Indicator For MT5 Trading Signals
The indicator plots the oscillator with a white stochastic line with 80 and 20 levels in a separate indicator window. Additionally, it plots a heat map with the color lime green for a bullish market and red for a bearish one.
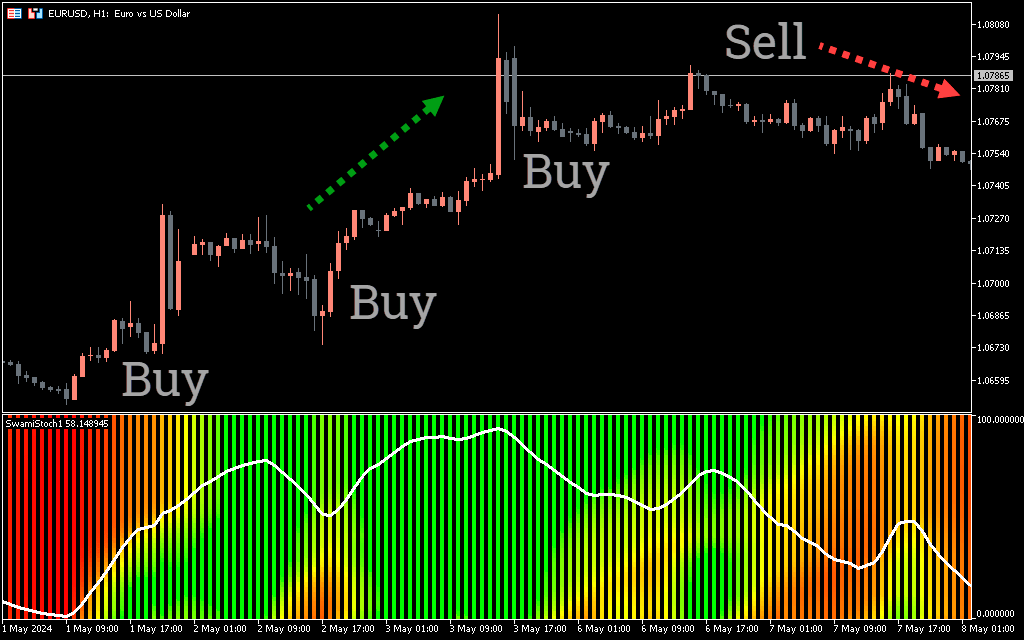
The main difference between this indicator and the regular version of the stochastic indicator is the heat map. This is very useful in technical analysis. This helps traders differentiate between bullish and bearish conditions at a glance. Moreover, the indicator uses multiple stochastic periods to identify overbought and oversold conditions. The trading strategy is to enter markets after exiting overbought and oversold zones.
Traders can enter a buy trade if the indicator values dip below 20 and reverse above 20. The stop loss should be placed below the previous swing low. In fact, traders should hold positions and exit if the indicator values exceed 80 to ensure a good risk-reward ratio. Using a similar trading strategy, you can use a sell trade if the indicator values exceed 80 and reverse.
Setting
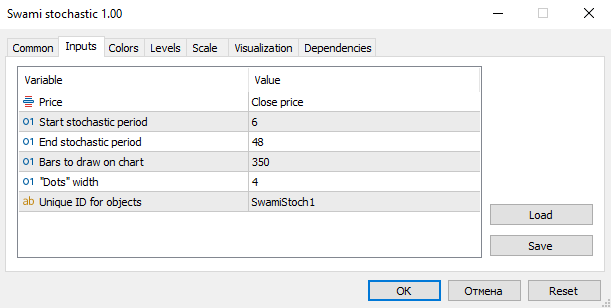
Price: Closing prices.
Start Stochastic Period:, End Stochastic Period: Stochastic Period to start and end.
BarsToDraw on chart:, “Dots” Width: Number of history bars and their width.
Conclusion
Thus, the Swami Stochastic Indicator for MT5 is an overbought and oversold indicator with a heat map.