Supply and demand zones are one of the most basic things a beginner forex trader learns. These zones are so important, price reacts off of them even after years since they first developed. And with the supply and demand zones indicator, a forex trader might not need to worry about drawing all these historical zones one after the other.
The Supply and Demand Zones Indicator for MT4
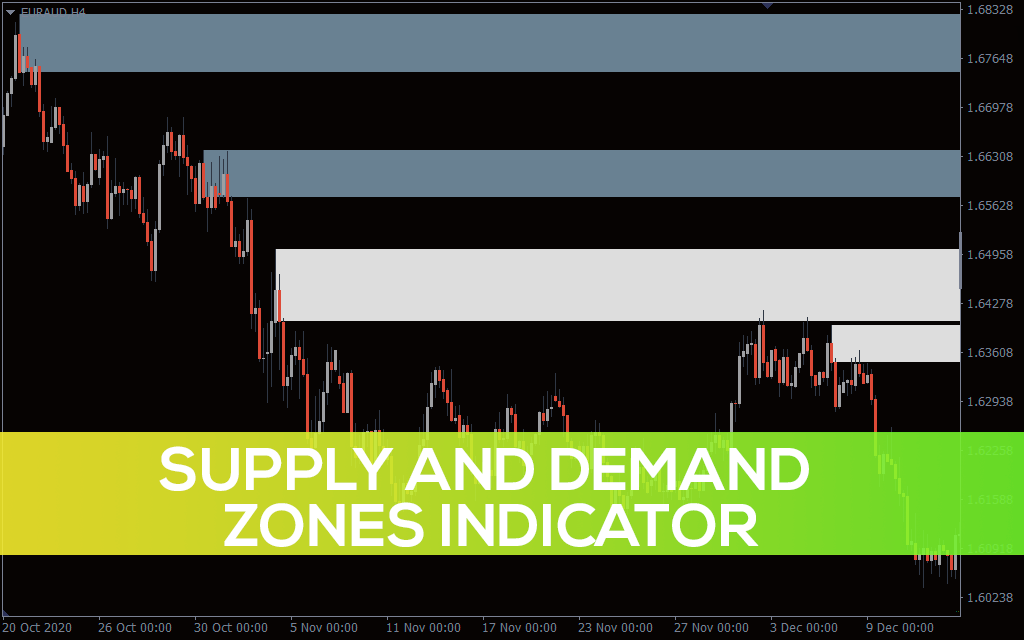
The supply and demand zone indicator accurately draws the supply and demand zones of a currency pair on the chart. You will find these zones in two colors on your MT4. One is white, which signifies zones that have been retouched recently. The other zone is painted grey, and it signifies zones that are yet to be touched. And somewhere in the settings, a trader can tweak the indicator to make it display the Fibonacci retracement between zones.
How to Use the Supply and Demand Zones Indicator
The supply and demand zone indicator is quite easy to use. Since supply and demand zones are basically support and resistance zones, you can use this indicator in much the same way.
Price often hits the supply zone and bounces back down. And when it hits the demand zone, it bounces up. So, a trader could take advantage of this predictability and make trades off of it. The rule of trading supply and demand is to sell at supply and buy at demand.
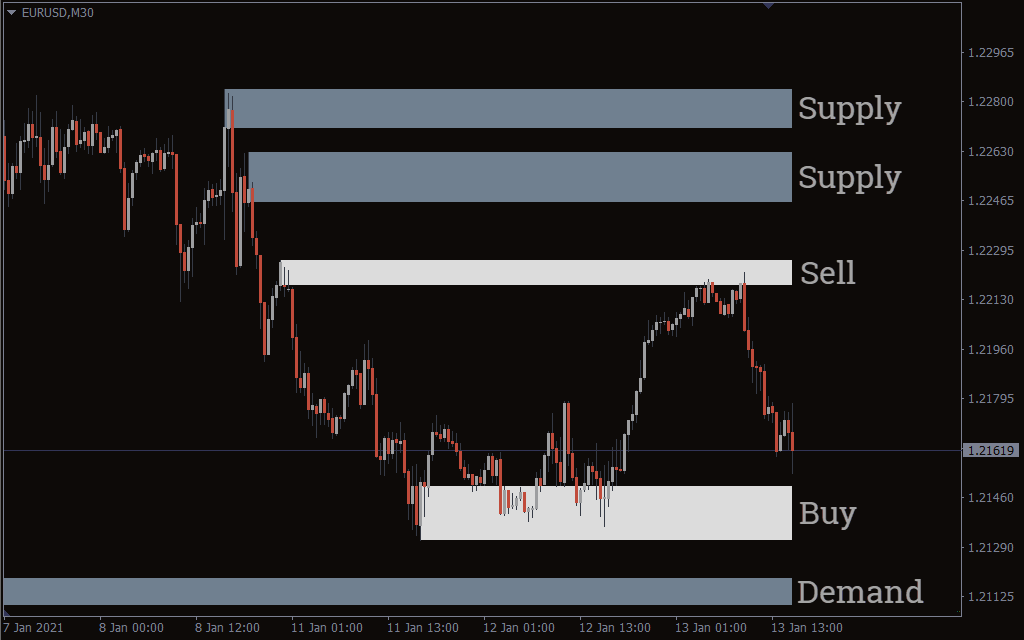
In addition, only trust the retouched zones (the white zones). The white-colored zone is reliable, as the price has tested it at least twice. The grey colored zones are good for observing potential reliable zones.
Who is the Supply and Demand Zone Indicator Best for?
The supply and demand zone indicator is best for all forex traders. Beginner traders who are having trouble recognizing support and resistance levels may find it more useful than those who don’t.
Pro forex traders who draw their zones differently from how they appear on this indicator may find it less useful to them. However, the accuracy of this indicator can’t be denied, and so it could be a useful tool to anyone who uses the supply and demand in their trading.
And once again a little about the zones…
Construction:
Demand Zones: Formed where the price sharply rises, indicating strong buying interest. When revisited, these zones often trigger buying activity.
Supply Zones: Created where the price drops sharply, signaling strong selling pressure. Sellers may become active when the price returns to these zones.
Types:
Fresh Zones: Recently formed and untested, considered strong due to unfilled orders.
Tested Zones: Have been tested by price; still relevant but may weaken over time.
Differences from Support and Resistance Levels
Supply and Demand Zones: Cover broader price ranges, based on volume and market movement, making them more significant long-term.
Support and Resistance Levels: Specific price points, often determined by historical touches, better suited for short-term trading.
Pros and Cons
Pros:
Accuracy: More reliable entry/exit points based on real market activity.
Longevity: Remain relevant over time, aiding long-term trade planning.
Cons:
Complexity: Harder to identify without indicators.
Uncertainty: Broader zones can create ambiguity in entry timing.
Setting
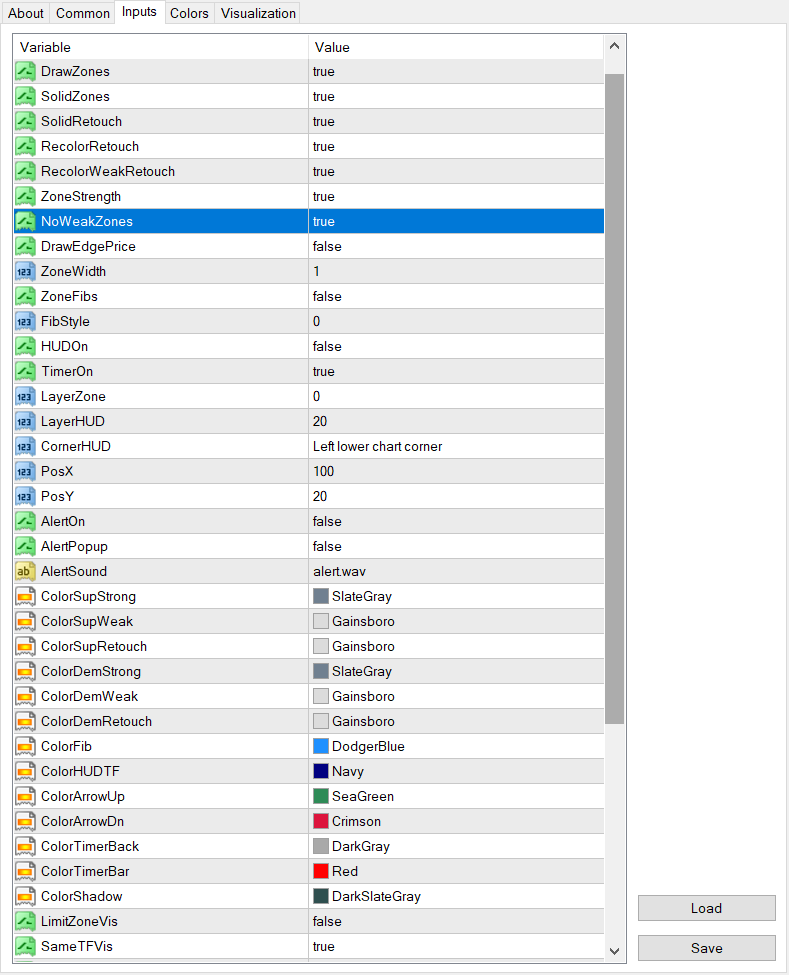
Here are the settings that come with the supply and demand zones indicator.
TimeFrame: Choose the timeframe whose zones you want to see on your current chart.
DrawZones: Erases all zones from the chart when set to “false”.
SolidZones: Adds or removes color to the zones.
SolidRetouch: Adds or removes color from zones that have been retouched.
RecolorRetouch: Lets retouched zones gain new color.
RecolorWeakRetouch: Lets weak retouched zones gain new color.
ZoneStrength: No visible effect on the chart.
NoWeakZones: This lets you add or remove weak zones.
DrawEdgePrice: Puts currency pair prices at the edge of each zone.
ZoneWidth: No visible effect on the chart.
ZoneFibs: Displays a Fibonacci retracement tool at the right end of the chart when it’s set to “true” along with “HUDOn”.
FibStyle: No visible effect on the chart.
HUDOn: Puts a triangle at the bottom left corner of the chart that is either upright or upside down, depending on the price direction within two zones.
TimerOn: No visible effect on the chart.
LayerZone: No visible effect on the chart.
LayerHUD: No visible effect on the chart.
CornerHUD: Describes the position where the HUD should be displayed.
PosX: Changes the position of the HUD.
PosY: Changes the position of the HUD.
AlertOn: Alerts you when a zone forms.
AlertPopup: This shows a popup for alerts.
ColorSupStrong: Changes the color of the strong supply zones.
ColorSupWeak: Changes the color of the weak supply zones.
ColorSupRetouch: Changes the color of the retouched supply zones.
ColorDemStrong: Changes the color of the strong demand zones.
ColorDemWeak: Changes the color of the weak demand zones.
ColorDemRetouch: Changes the color of the retouched demand zones.
ColorFib: Changes the color of Fibonacci retracement.
ColorHUDTF: Changes the color of the HUD.
ColorArrowUp: Changes the color of the Up arrow.
ColorArrowDn: Changes the color of the Down arrow.
ColorTimeBack: Changes timeback color.
ColorTimerBar: Changes timer bar color.
ColorShadow: Changes shadow color.
LimitZoneVis: No visible effect on the chart.
SameTFVis: No visible effect on the chart.
ShowOnM1: No visible effect on the chart.
ShowOnM5: No visible effect on the chart.
ShowOnM15: No visible effect on the chart.
ShowOnM30: No visible effect on the chart.
ShowOnH1: No visible effect on the chart.
ShowOnD1: No visible effect on the chart.
ShowOnW1: No visible effect on the chart.
ShowOnMN: No visible effect on the chart.
PriceWidth: No visible effect on the chart.
TimeOffset: No visible effect on the chart.
GlobalVars: No visible effect on the chart.