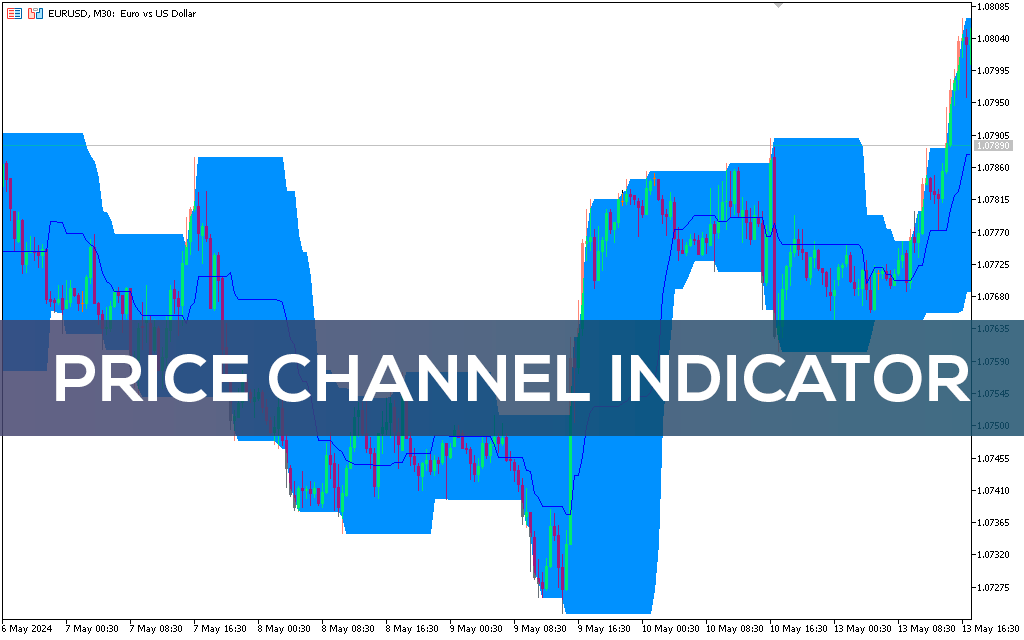
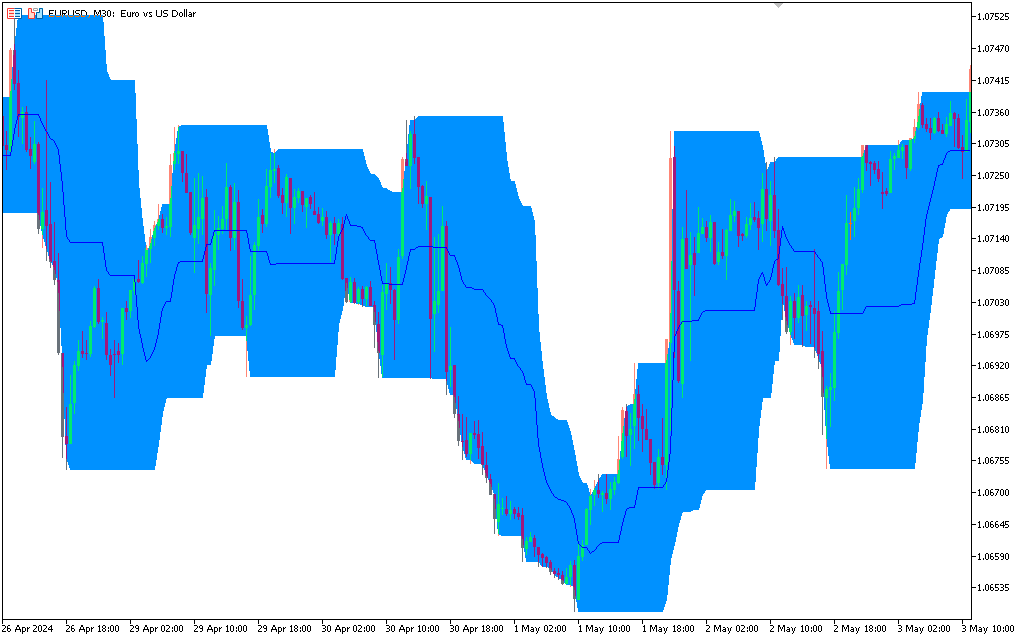
The Price Channel indicator for MT5 builds a channel using price data from a higher time frame. Additionally, it builds a histogram based on trading activity. In addition, it draws support and resistance lines on the chart. This H4 based channel is visible on all lower time frames, allowing the forex trader to enter traders more accurately.
This channel indicator is easy to use and useful for both new and experienced Forex traders. It works on all timeframes below H4. Thus, this indicator is useful for Forex day traders and short-term traders.
Price Channel Indicator For MT5 Trading Signals
The indicator draws a blue line at the top of the histogram and light blue and gray channel zones. The area of dots represents where 60% of trades occur. However, it is in the area of the dotted line that 90% of transactions occur.
Price movement above the blue line is bullish, below it is bearish. So, the best trading strategy is to wait for prices to go to extremes above or below the histogram and reverse. However, traders can enter the market after the red line is broken during a reversal.
Traders can enter the market with a buy trade and place a stop loss below the previous swing low in a bullish condition. Likewise, if the price moves below the red line, traders can enter short positions with a stop above the previous swing high. The best profit-taking strategy is to exit when there are opposite signals.
Traders should note that the blue lines represent support and resistance lines and provide intraday entry and exit points.
Setting
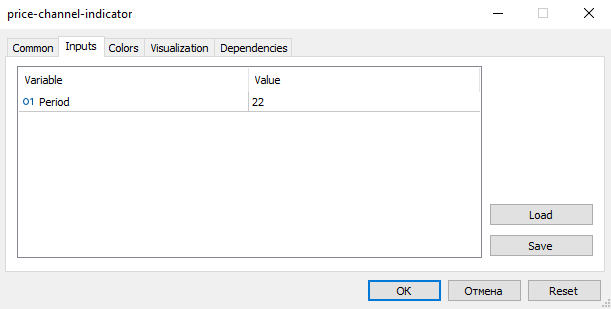
Period: Period for histogram channel calculation.
Conclusion
Thus, the Price Channel indicator for MT5 is based on price data and trading activity. Because it does not require any other calculations or data, the results are useful.