By default, MT4 doesn’t unfortunately have indicators that can analyze charts using the Price Action method by default.
Free Price Action Scaner indicator will help you tackle this problem. We suggest you to read its description in our article.
Contents:
1. Why to use Price Action
2. PriceActionScaner indicator and its features
1. Why to use Price Action Scaner
Price Action is the method of chart analysis that uses only primary data – market price – to make trading decisions. This approach suggests applying price patterns as basic tools.
The inverse method of analyzing charts comes down to using technical analysis indicators, as well as trading robots and Expert Advisors (EA). They process data on prices and volumes and generate trading signals based on this.
Both these approaches are effective enough and can be useful for Forex trading. However, while MT4 has a great number of indicators from the second group, there are virtually no Price Action tools in the MT4.
2. Price Action Scaner indicator and its features
PriceActionScaner is a free MT4 indicator that analyzes the chart of the selected asset and automatically plots certain price patterns (setups) on it.
PriceActionScaner draws price patterns on all timeframes of the MT4 terminal. When using it, the priority of timeframes should be kept in mind. The higher the timeframe, the less market noise will be taken into account and thereby the more accurate the signals will be.
The indicator includes a total of 7 Price Action patterns:
- DBHLC & DBLHC pattern (Double Bar Lows Higher Close & Double Bar Highs Lower Close) or bullish/bearish setups.
It’s made up of two candlesticks having the same lows/highs of shadows, but a higher/lower closing price of the second candlestick.
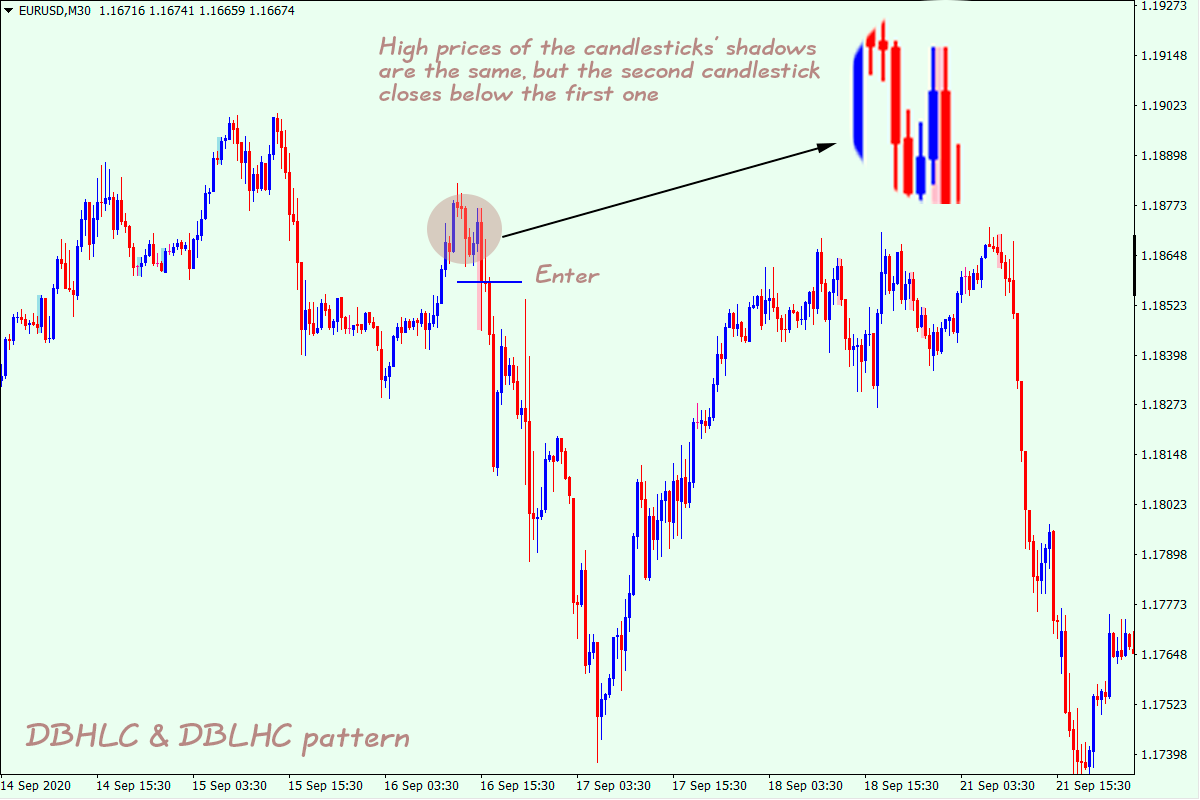
As a rule, bullish and bearish setups occur during a fairly strong trend and indicate its continuation.
- TBH&TBL (Two Bars High & Two Bars Low) pattern or two bars having the same High/Low price.
It occurs when two candlesticks having the same highs/lows of shadows appear on the chart. This pattern can be seen at the price extremes, when one trend is replaced by another.
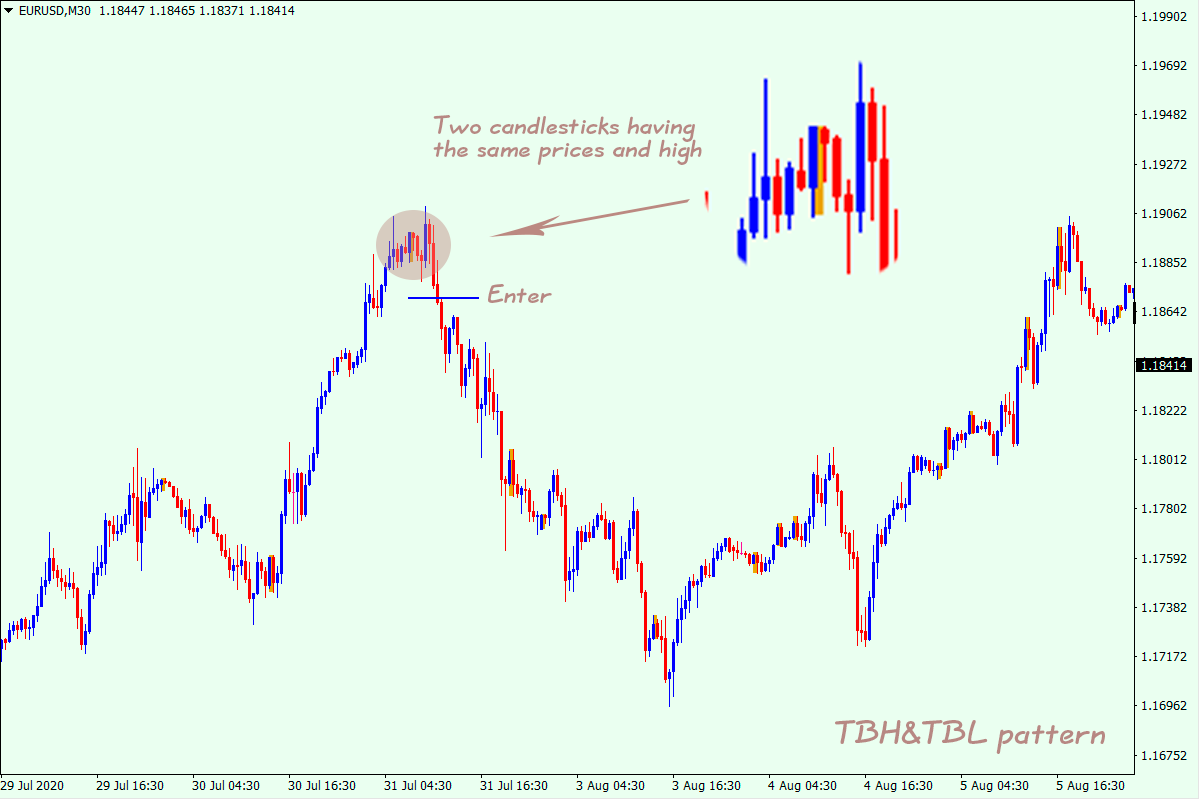
In this case, the pattern indicates that buyers don’t have the strength needed to further boost their activity.
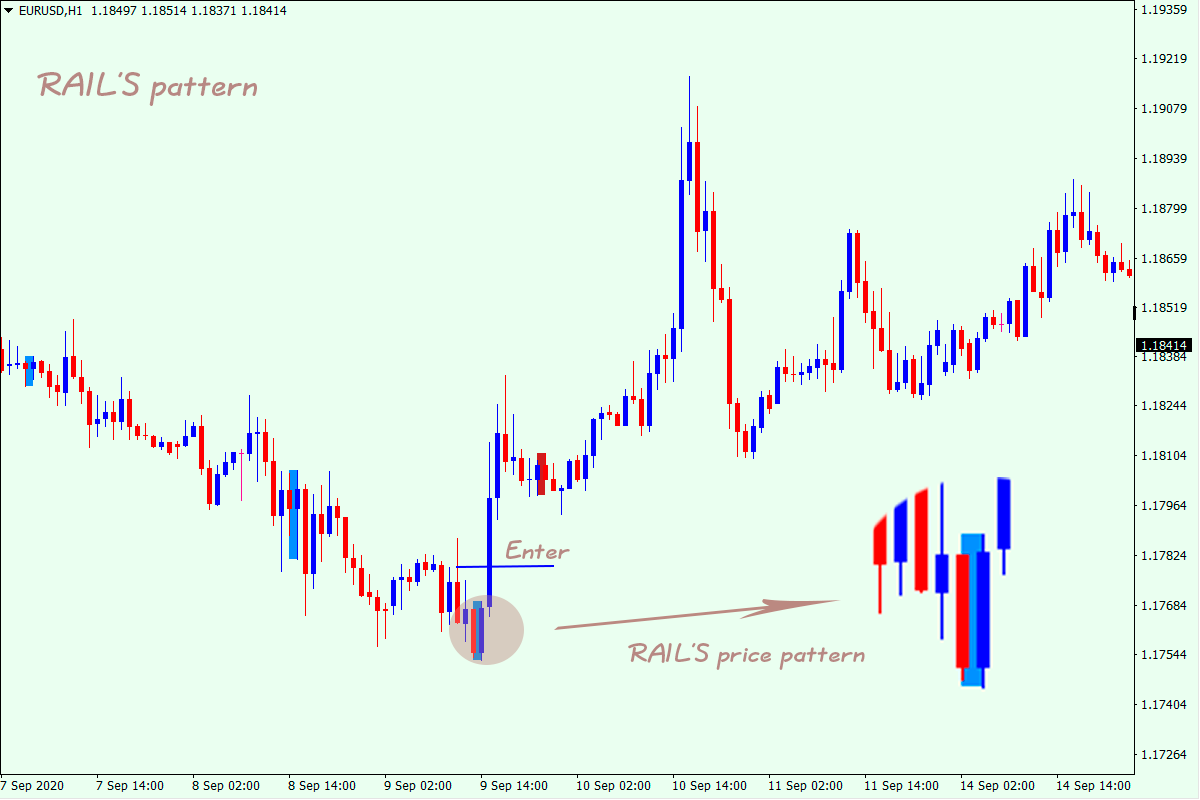
- RAIL’S pattern.
It usually gives signals during a strong trend. Depending on its position on the chart, it acts both as trend continuation or trend completion pattern.
It’s essential that the candlesticks are long and have short shadows. Such a configuration of candlesticks indicates the high activity of Forex market participants. If this is the case, trading signals can be more reliable.
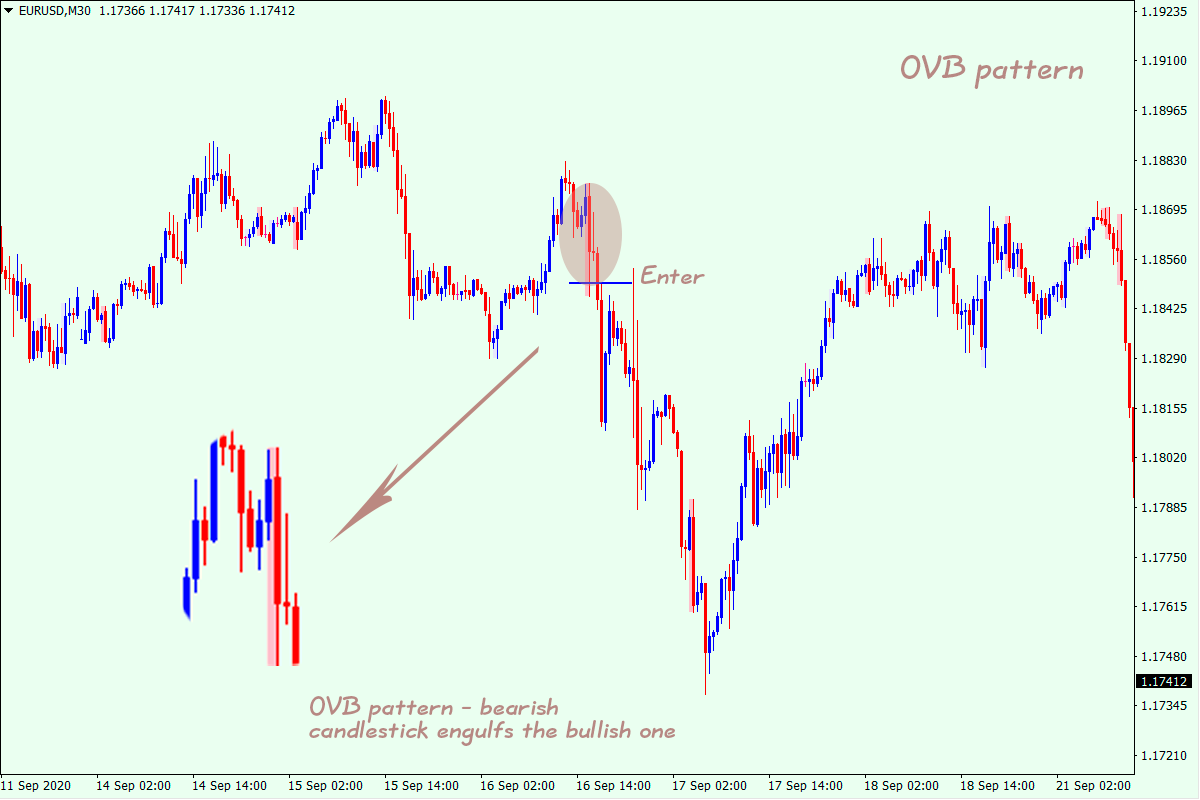
- OVB pattern (Bullish pattern & Bearish pattern) or engulfing.
The template is made up of two candlesticks. The second candlestick has a lower opening price and a higher closing price (for Buy trend; the opposite is true for Sell trend) relatively to the first one. This is why the pattern is called engulfing – visually, the second candlestick’s body completely engulfs that of the first one (not allowing for its shadows).
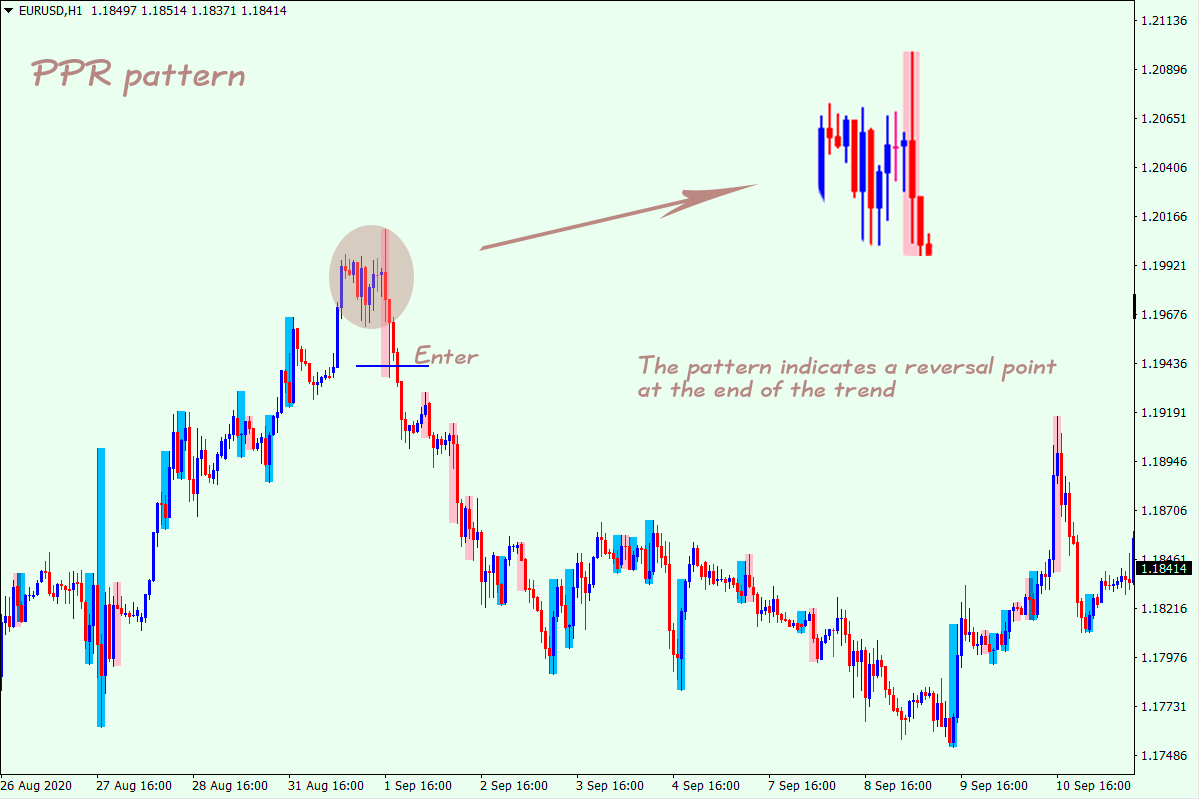
- PPR (Reversal Pivot Point) pattern or reversal point.
This formation consists of three candlesticks. Usually, the pattern indicates potential trend reversal points rather than its continuation.
In this case, the third candlestick doesn’t close below the low or above the high of the second candlestick, but hits a new extreme.
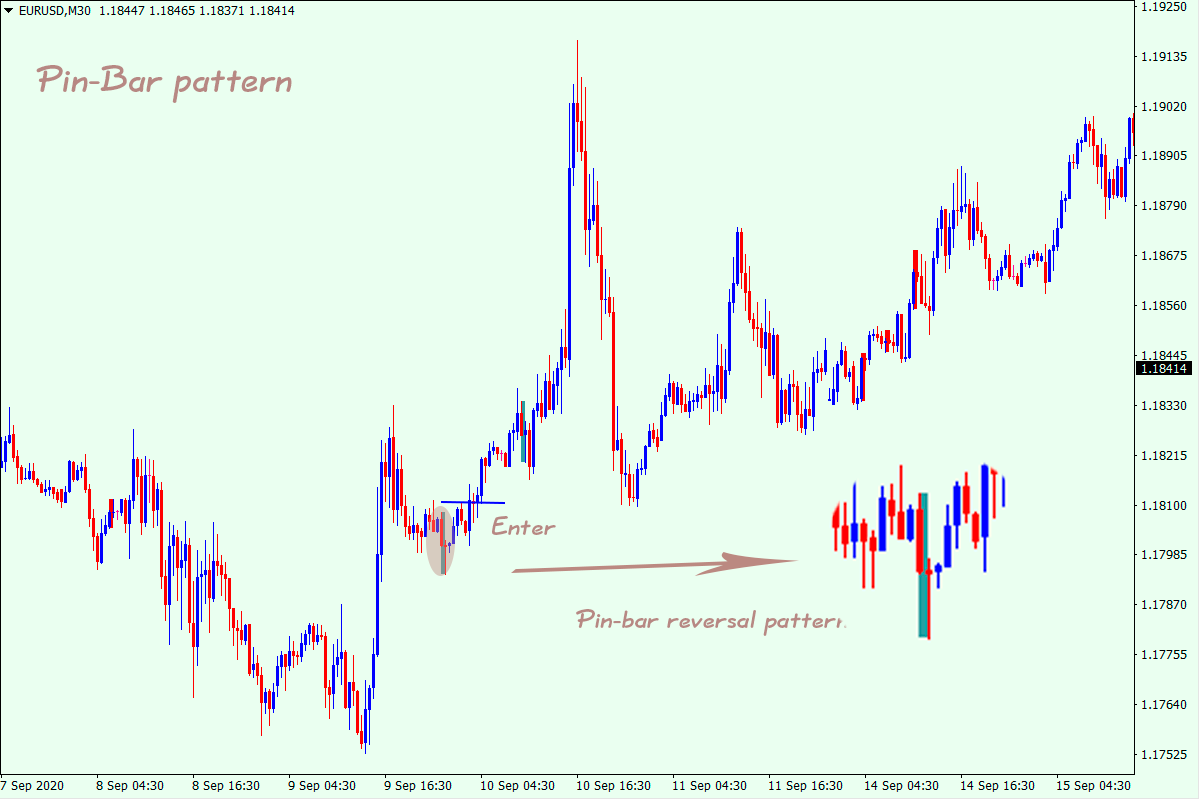
- Pin-Bar pattern or pin-bar.
A pin bar looks like a candlestick with a long shadow and its opening and closing prices are close to each other. This pattern often acts as a trend reversal signal. Due to its easy use and efficiency, it’s popular enough among Forex market participants.
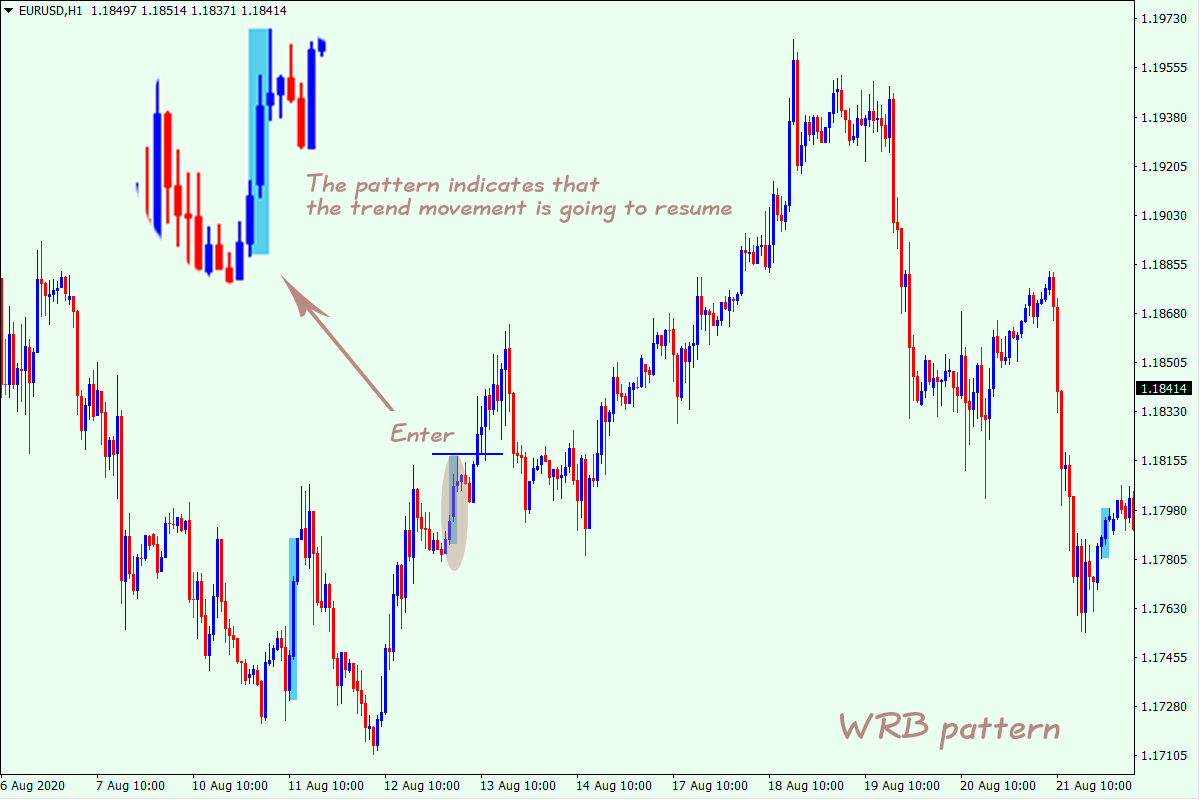
- WRB (Wide Range Bar) pattern or widening bar.
WRB highlights two bullish/bearish candlesticks simultaneously. Most often, the pattern forms when the retracement move has completed and signals the resumption of the major trend.
As you know, market points are more reliable when several analysis tools suggest opening a position. Thus, the price activity indicator will be more helpful when used either with other indicators or the primary trading system.
When you use the indicator for the first time, you’ll need to spend some time customizing its parameters.
The PriceAction_Scaner indicator can eventually be a useful complement to your Forex trading system.
The indicator draws formations on all timeframes that makes it more one-size-fits-all. So, no matter which approach you practice in trading (swing trading, scalping, intraday trading or long-term trading), the chart will always display trading situations with promise of profits.
Setting
The indicator has numerous settings, so you can select the parameters that best match your trading system.
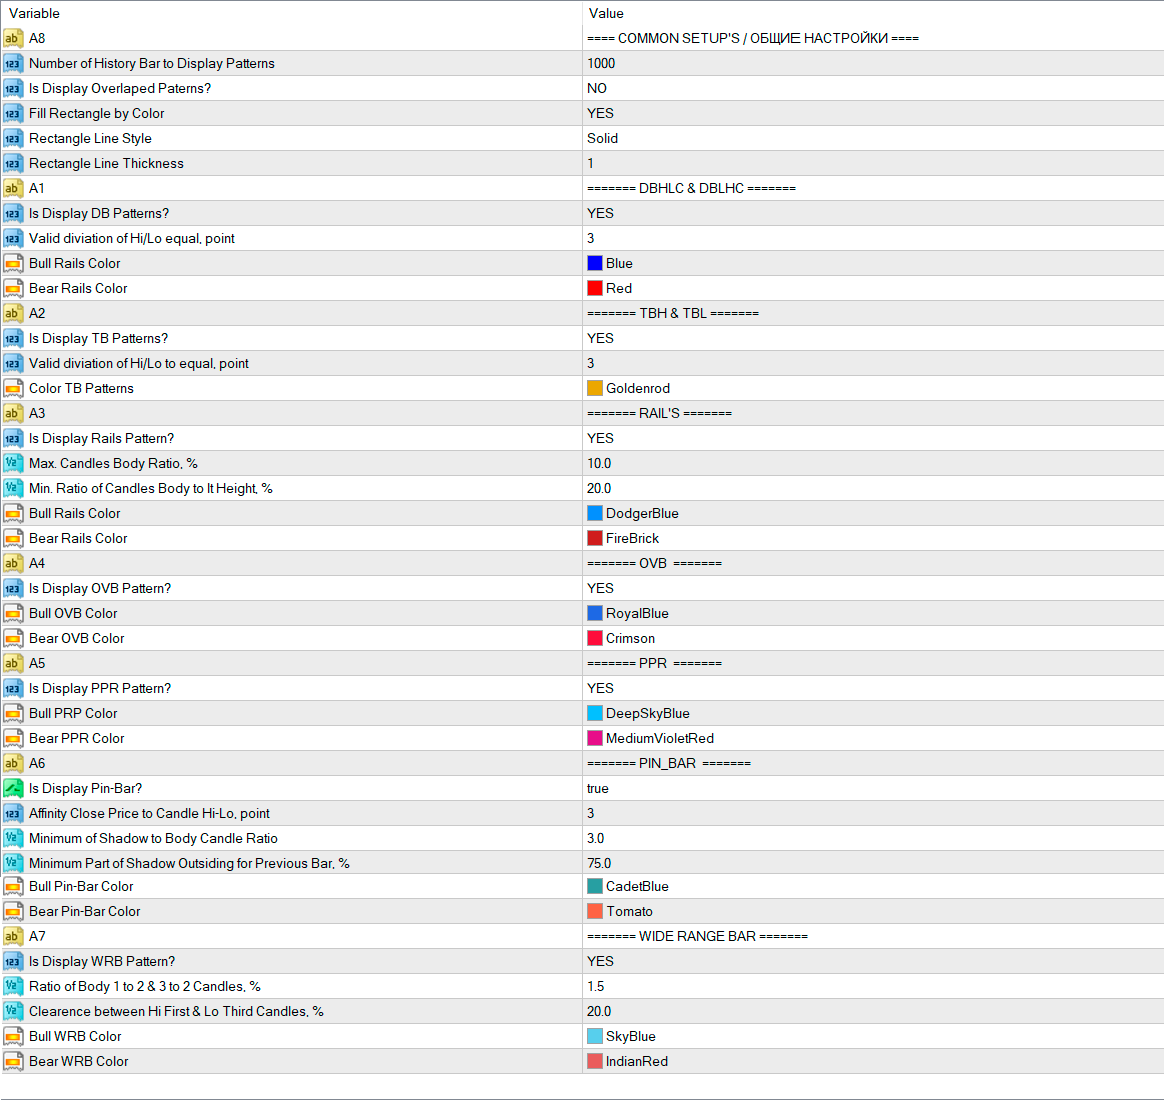
A8 – GENERAL SETTINGS
Number of History Bar to Display Patterns – selects the number of bars used to display patterns.
Is Display Overlaped Patterns? – enables/disables drawing patterns.
Fill Rectangle by Color – selects how to display patterns: along the contour only or by color fill.
Rectangle Line Styles – selects the line styles of patterns
Rectangle Line Thickness – sets the thickness of pattern lines
A1 – DBHLC & DBLHC pattern settings
Is Display DB Patterns? – enables/disables drawing the pattern.
Valid diviation of Hi/Lo equal. point – allows you to select the acceptable deviation in points when drawing the pattern.
Bull Rails Color – enables to choose the color of bullish signal.
Bear Rails Color – enables to choose the color of bearish signal.
A2 – TBH&TBL pattern settings
Is Display TB Patterns? – enables/disables drawing the pattern.
Valid diviation of Hi/Lo equal. point – allows you to select the acceptable deviation in points when drawing the pattern.
Color Patterns – selects the pattern’s color.
A3 – RAIL’s pattern settings
Is Display Rails Pattern? – enables/disables drawing the pattern.
Max. Candles Body Ratio, % – allows you to select the maximum percentage ratio between the bodies of two candlesticks that allows drawing the pattern.
Min. Ratio of Candles Body to Height, % – allows you to select the minimum percentage ratio between the bodies of two candlesticks that allows drawing the pattern.
Bull Rails Color – enables to choose the color of bullish signal.
Bear Rails Color – enables to choose the color of bearish signal.
A4 – OVB pattern settings
Is Display Rails Pattern? – enables/disables drawing the pattern.
Bull OVB Color – enables to choose the color of bullish signal.
Bear OVB Color – enables to choose the color of bearish signal.
A5 – PPR pattern settings
Is Display PPR Pattern? – enables/disables displaying the pattern.
Bull PRP Color – enables to choose the color of bullish signal.
Bear PRP Color – enables to choose the color of bearish signal.
A6 – PIN BAR pattern settings
Is Display Pin-Bar? – enables/disables displaying the pattern.
Affinity Close Price to Candle Hi-Lo, point – allows you to select the value of the distance between the closing price and the high price of a candlestick in points.
Minimum of Shadows to Body Candle Ratio – allows you to select the minimum ratio of the size of shadows to the body of a candlestick.
Minimum Part of Shadow Outsiding for Previous Bar, % – allows you to select the minimum percentage ratio of the size of shadow of the current candlestick to that of the previous candlestick.
Bull Pin-Bar Color – enables to choose the color of bullish signal.
Bear Pin-Bar Color – enables to choose the color of bearish signal.
A7 – WIDE RANGE BAR pattern settings
Is Display WRB Pattern? – enables/disables displaying the pattern.
Ratio of Body 1 to 2 & 3 to 2 Candles, % – allows you to select the percentage ratio of the body of the first and third candlesticks to that of the second one.
Clearance between Hi First & Lo Third Candles, % – allows you to select the percentage difference between the high of the first candlestick and the low of the third one.
Bull WRB Color – enables to choose the color of bullish signal.
Bear WRB Color – enables to choose the color of bearish signal.