You probably know that the asset value is determined based on a large number of factors in the Forex market.
One of them is the behavior of market participants. Unfortunately, it’s quite a hard work understanding the motives of bulls and bears.
The free Mtf ZigZag indicator technical analysis indicator can help you to tackle this problem. We invite you to learn about it in the article.
Contents:
1. Description
2. How to use
1. Description
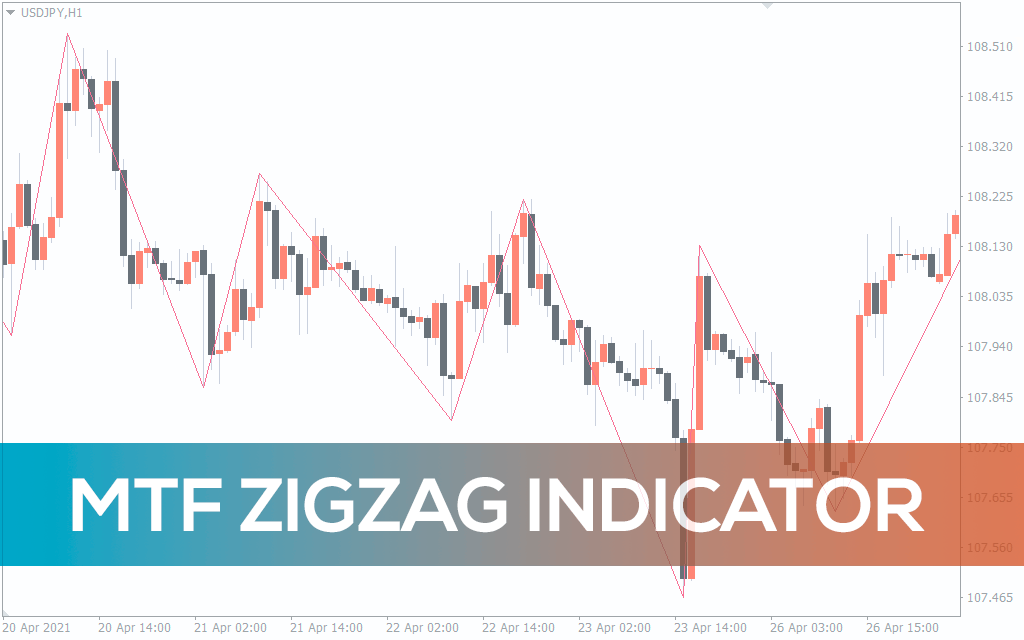
Mtf Zig Zag is a technical analysis indicator that analyzes price behavior and marks sell-off and rally waves with lines.
Due to various kinds of factors, trading activity on all trading venues is quite high. Additionally, robots and trading Expert Advisors (EA or ea for short) that automatically make trades on all timeframes are used in the Forex market.
Therefore, due to the large volume of transactions, it’s not uncommon for MetaTrader 4 (MT4) charts to show chaotic and impulsive fluctuations of the currency exchange rates. They are also referred to as the “market noise” that often interferes with the daily work in the Forex market.
Accordingly, the core task of the Mtf ZigZag indicator is to filter out true price movements from the false ones, thereby indicating important price zones.
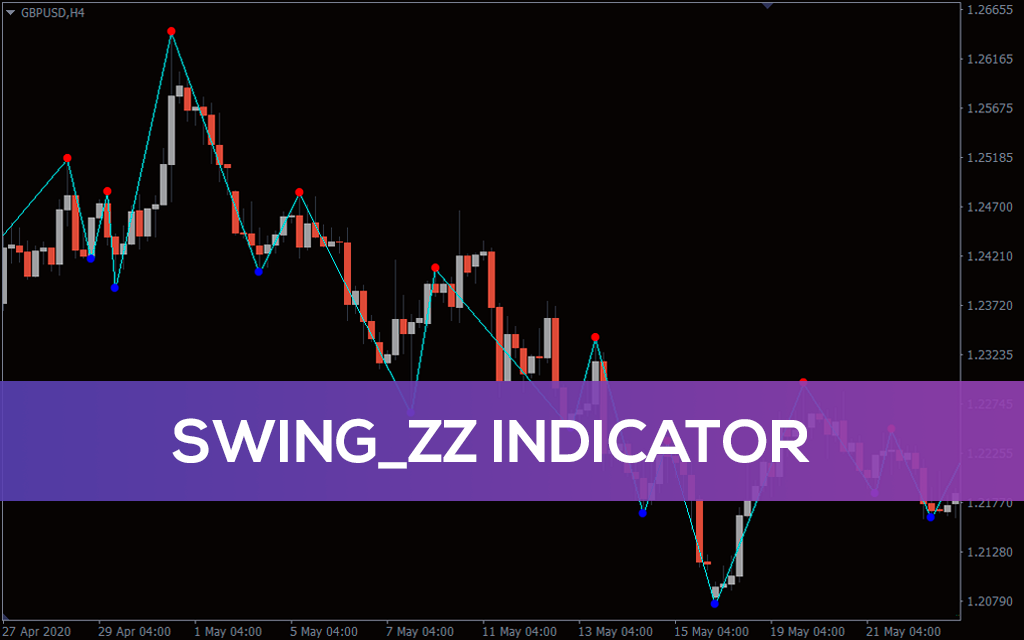
Visually, the indicator looks like a continuous line connecting the most important extremes.
The indicator plots levels based on the following parameters: ExtDeviation, ExtDepth, and ExtBackStep. You can read their description in the Settings section. Now let’s consider the examples of how we can use the indicator.
2. How to use
The Mtf ZigZag indicator doesn’t provide entry points as such. However, thanks to the simple and clear display of signals (alerts), the indicator may be useful in the following situations:
- identifying support and resistance levels.
Support and resistance levels are technical analysis tools widely used by Forex market participants. Visually, they look like values where sell-off and rally waves repeatedly emerged.
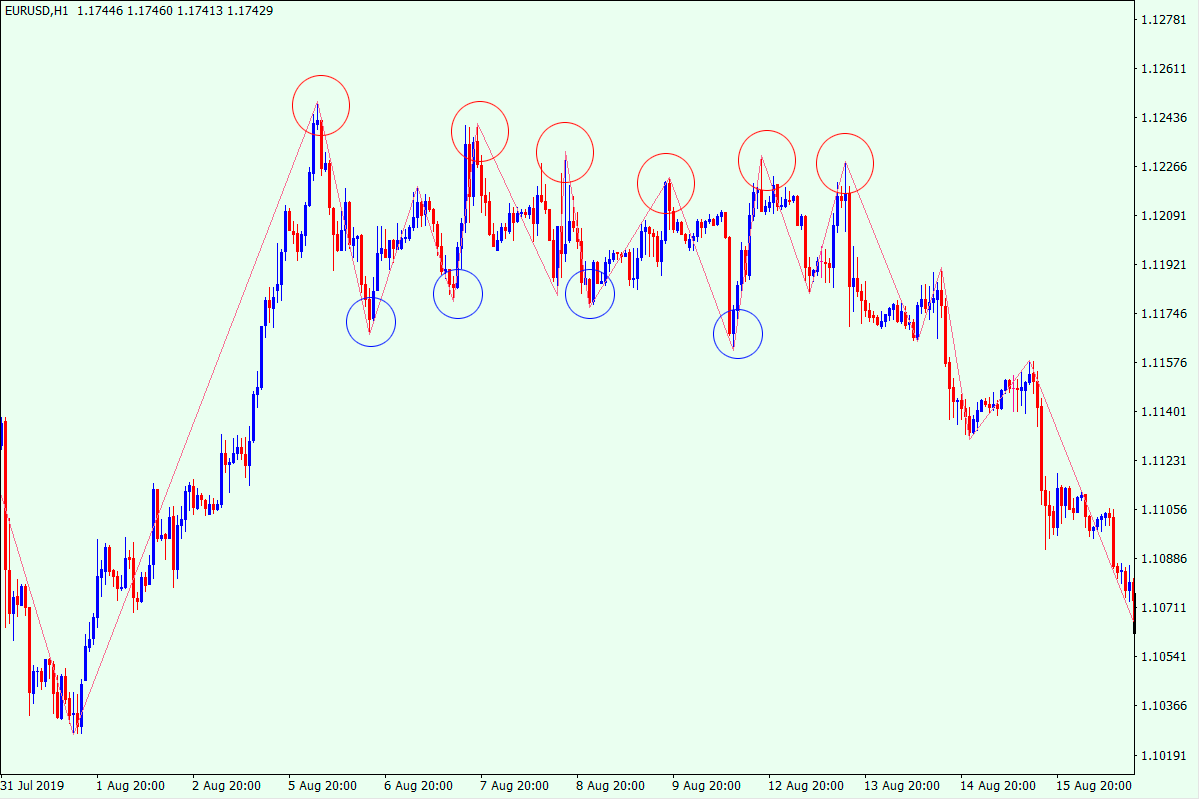
This chart shows the indicator displaying the highest (red color) and lowest (blue color) values. They act as support and resistance zones.
When applying support and resistance levels, you should keep in mind that the more often the price has responded to them, the more trusting they’ll prove to be during trading. It’s also important to keep in mind the priority of timeframes: signals produced on the higher timeframes are stronger than those on the lower ones.
To make the process of identifying support and resistance levels easier, you can download the Support&Resistance indicator.
- when plotting trendlines.
Trendlines represent one of the key tools of technical analysis along with support and resistance zones.
By definition, trend is a series of higher highs and higher lows (for the bullish trend). The opposite is true for the bearish trend.
Since the indicator automatically marks highs and lows as the result of sell-off and rally waves, we can manually draw trendlines through them.
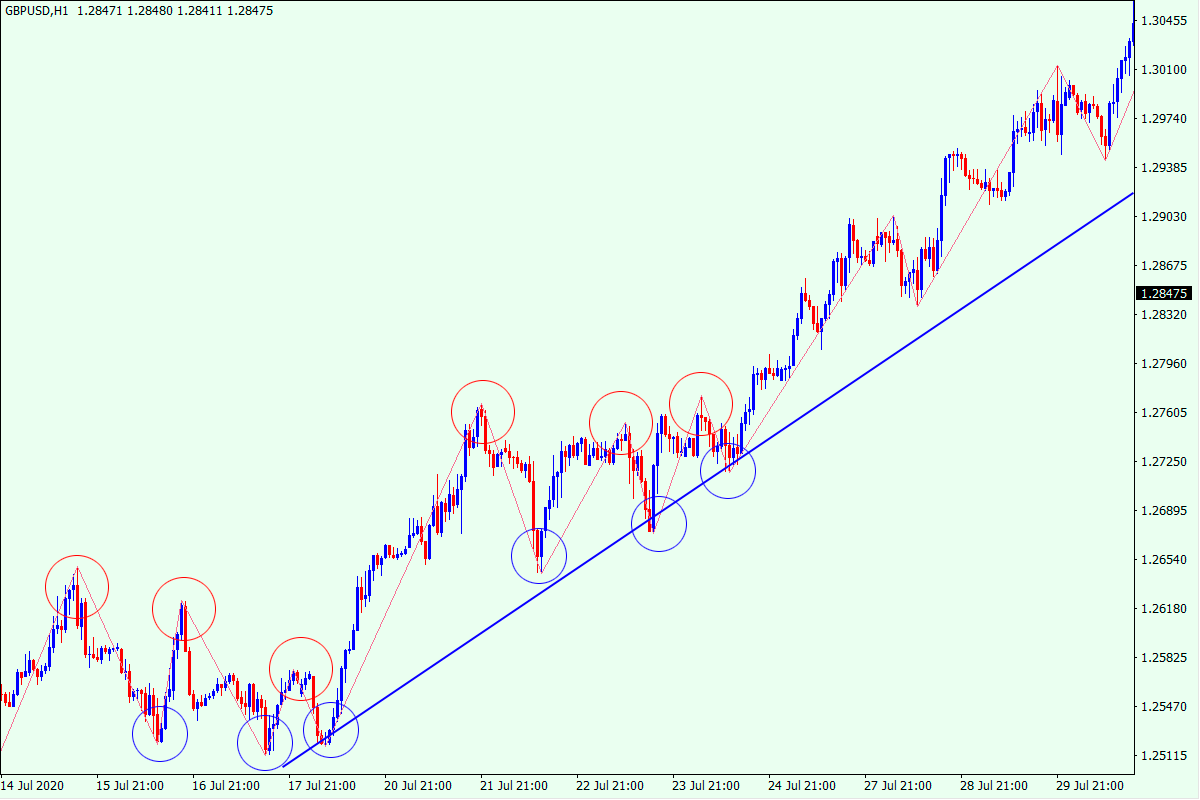
In this example, as with the support and resistance levels, the extremes are highlighted in red and blue.
We can see that at a particular moment in time new highs are made, but new lows occur higher and don’t repeat themselves. Therefore, we can manually draw a bullish trendline using higher lows for further trading with it.
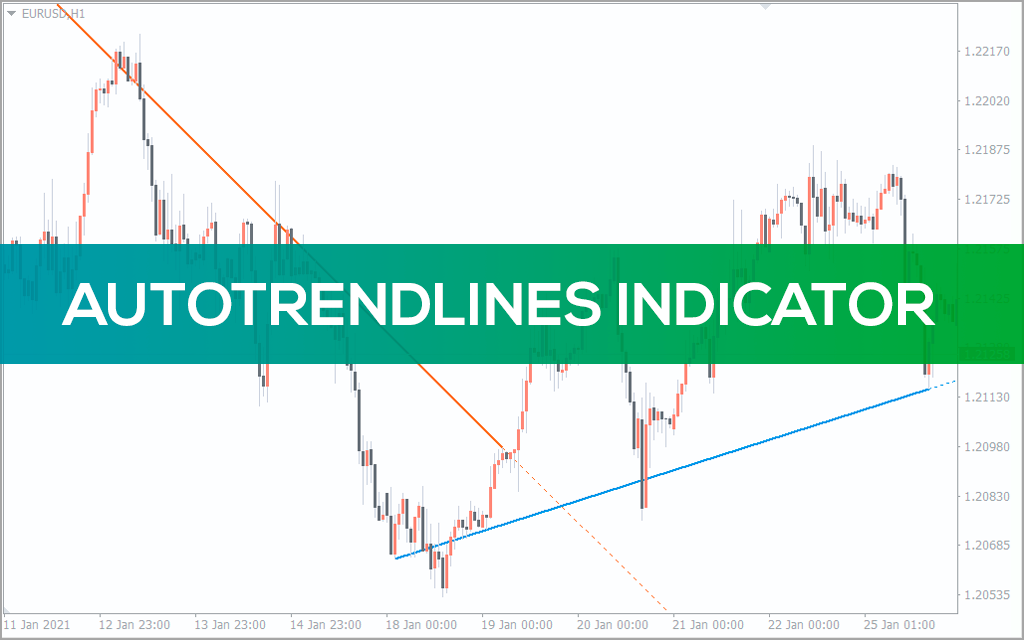
You can download the AutoTrendLines indicator to automatically draw trendlines.
- when plotting Fibo levels on MT4 chart.
Sell-off and rally waves are required to apply another technical analysis tool – the Fibonacci levels. The usefulness of this tool directly depends on how accurately the moves in the Forex market are recognized.
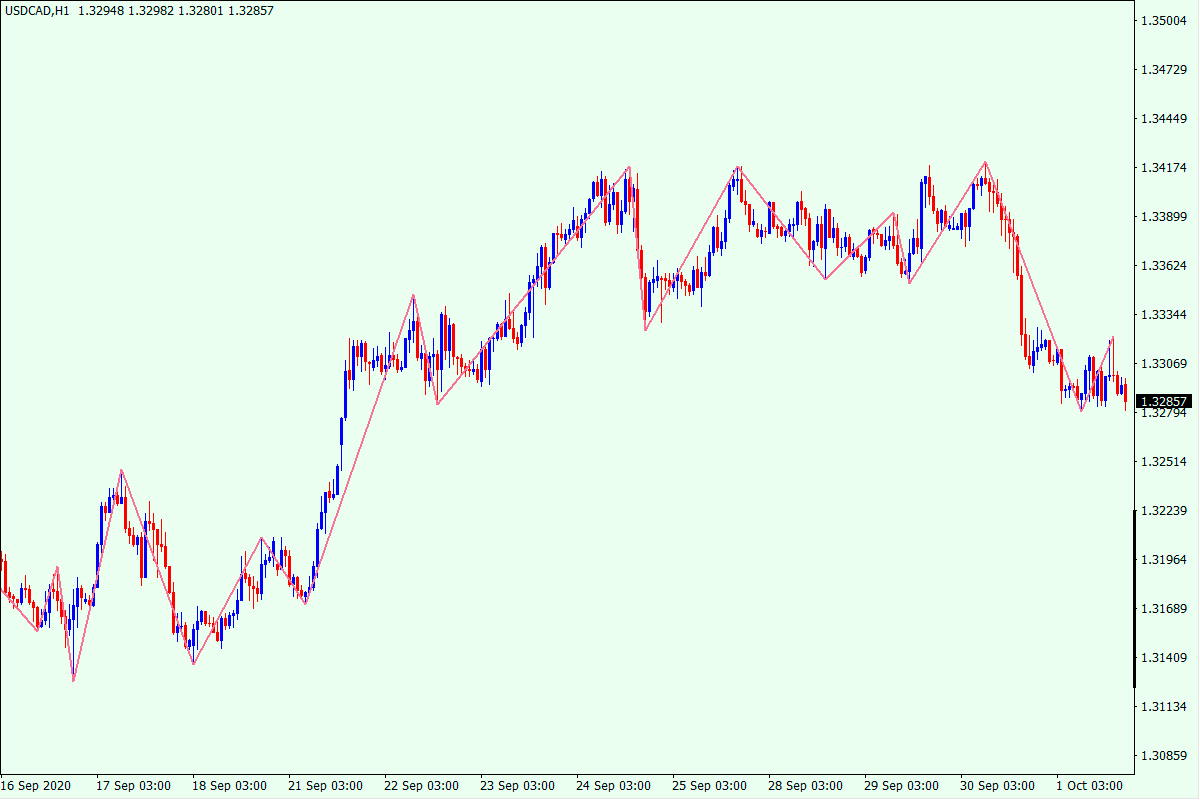
In this example, the Mtf Zig Zag indicator marks a rally wave, which we manually apply the Fibonacci extensions to. It’s entirely predictable that the price has reversed close to one of the levels (the value of 50%) and the uptrend has resumed anew.
If you’re just new to the Forex market or start getting to know about the Fibo levels, the free Fiboretracement indicator will help you to learn its details.
To get more market information, you can draw several ZigZag lines on multiple timeframes (short for mtf) at once. Thus, if you consider the signals produced on various timeframes, the indicator’s performance can be enhanced.
Setting
The indicator has the following settings:
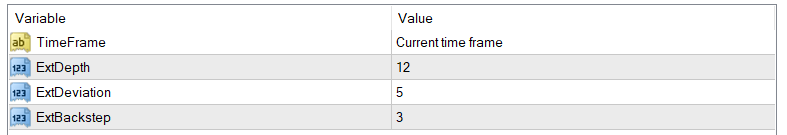
TimeFrame – enables you to select the timeframes to display the indicator.
ExtDeviation – allows you to customize the sensitivity (set in %) of the indicator’s filters. If the current candlestick’s high is lower than that of the previous one by the Deviation value, the given extreme won’t be respected by the indicator (for the bullish trend). The opposite is true for the bearish trend.
ExtDepth – allows you to select the number of candlesticks, above which the indicator will start searching for the already recognized pattern again.
ExtBackstep – allows you to select the number of candlesticks, above which the indicator will start searching for the extreme opposite to the current trend direction.
As with most technical analysis indicators, having installed it, you’ll need to spend some time selecting the settings that best fit your needs.
When you install the indicator and try it for the first time, you’ll most likely see its practical benefits and find a use for it in your daily work in the Forex market.