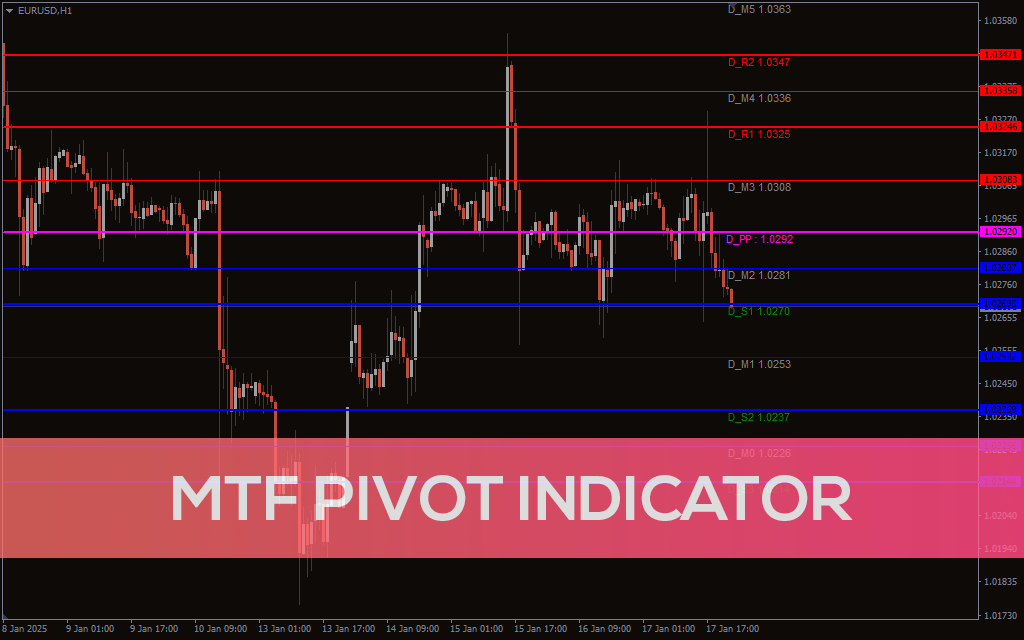
The MTF Pivot Indicator is designed to assist traders in analyzing key pivot levels across multiple timeframes simultaneously. By incorporating daily, weekly, and monthly pivots into a single chart, this tool provides a comprehensive overview of potential support and resistance areas, making it an invaluable resource for both novice and experienced traders. Its multi-timeframe approach ensures precise decision-making, allowing users to adapt to market dynamics effectively.
MTF Pivot Indicator Trading Signals
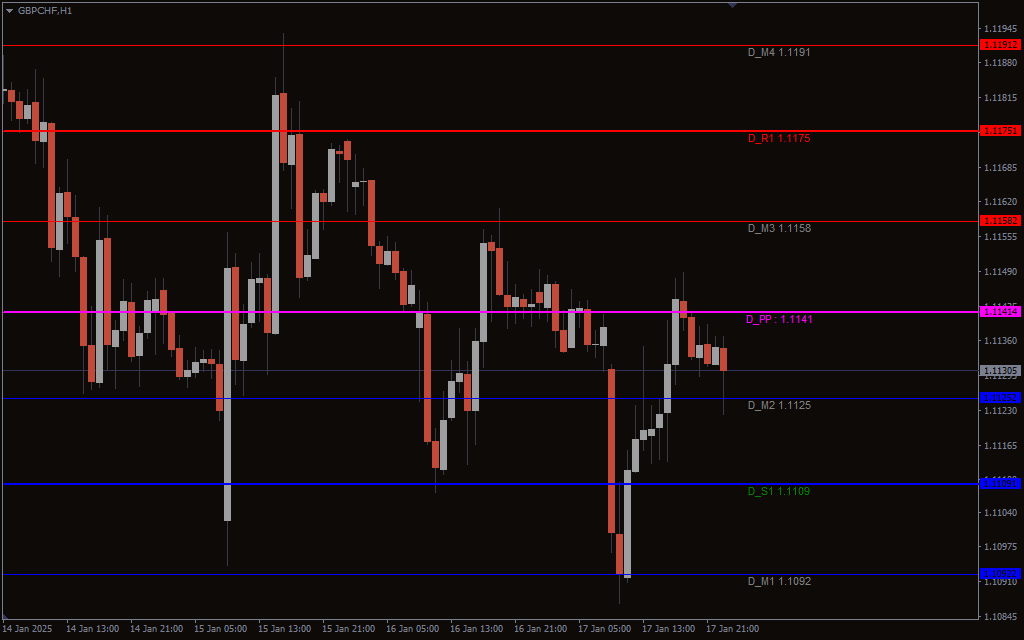
The MTF Pivot Indicator generates trading signals by analyzing pivot points as support and resistance levels. Price movements above the pivot point often indicate bullish momentum, while movements below suggest bearish sentiment. When combined with other technical analysis tools, these pivot levels can signal potential reversal points or continuation trends. This allows traders to make well-informed entries and exits, optimizing their risk-to-reward ratio.
Setting

midpivots: Enables or disables mid-pivot levels for additional granularity.
Fhr: Toggles hourly pivot levels on the chart.
daily: Activates daily pivot levels for short-term trading analysis.
weekly: Displays weekly pivot levels for medium-term strategies.
monthly: Includes monthly pivot levels for long-term trading plans.
InpChartShift: Adjusts the horizontal position of the indicator for better visualization.
LabelShift: Determines the offset for pivot labels on the chart.
Conclusion
The MTF Pivot Indicator is a vital tool for traders seeking precision and clarity in their trading strategies. Its ability to display pivot levels across various timeframes on a single chart allows for a comprehensive analysis of market trends. By leveraging these pivot levels, traders can identify key areas of support and resistance, improving their decision-making process. Integrate this indicator into your trading arsenal to gain a competitive edge and enhance your profitability.