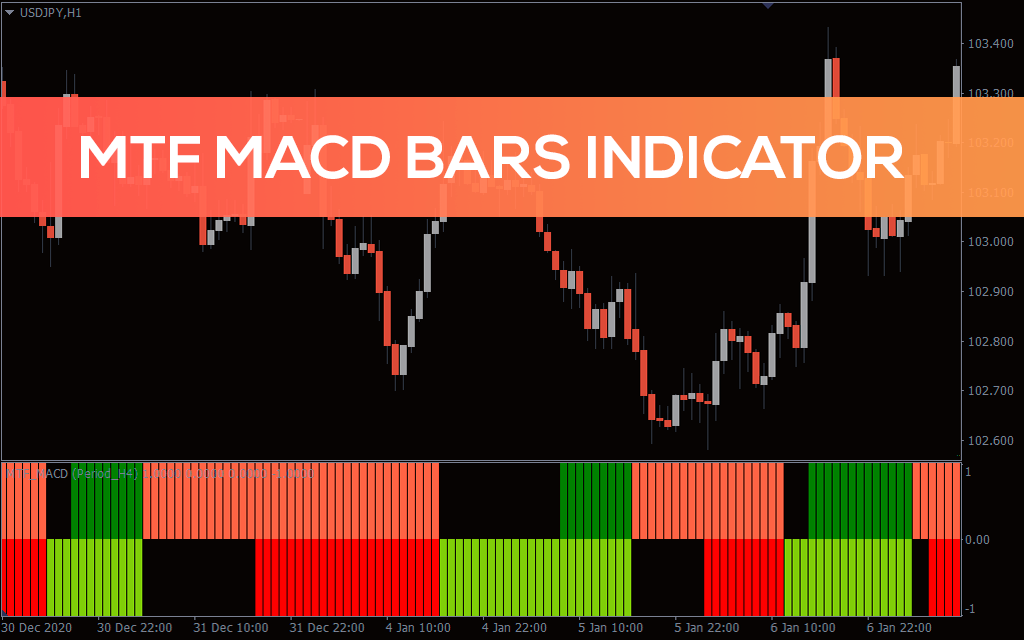
A multitude of forex traders uses the Moving average convergence and divergence indicator or the MACD indicator. The MACD indicator is considered reliable by forex traders, stock traders, and other financial instrument traders. The MTF MACD bars indicator can also display the Moving average convergence divergence values of a higher or lower time frame in the current chart’s indicator window. This provides both new and experienced forex and stock traders with best understanding of the trend available in the higher time frame.
The above USDJPY H4 MT4 chart shows the MTF MACD bars indicator marked with the possible buy and sell signals. The above chart shows the MACD signals from the current timeframe.
How to Trade forex successfully using the MTF MACD Bars Indicator?
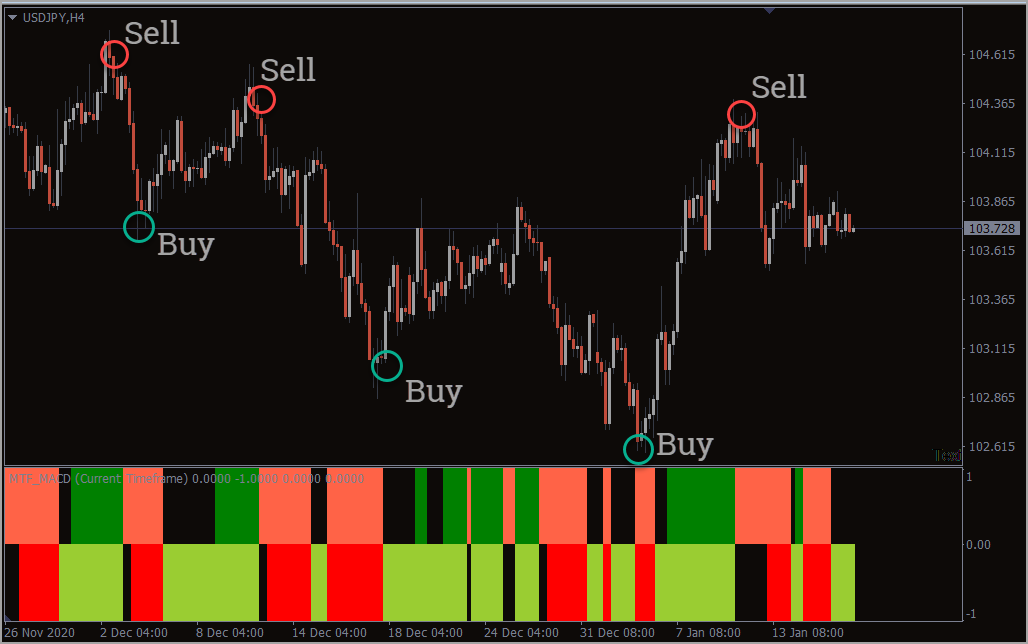
Technical traders can BUY and enter the markets when the color of the bars in the lower segment of the indicator turn Yellow Green. The trader can hold the position if the bar color in the upper segment changes to Green.
Similarly, technical traders can SELL at the sight of a TomatoRed color bar on the top segment of the indicator. The position can be held if the color of the bar in the lower segment changes to Red.
It is better to exit the BUY position if the bar’s color turns from YellowGreen or Green to RED. On the other hand, the change of color from Tomato Red or Red to Yellow Green warrants exiting a SELL position.
How to trade using a higher timeframe with MTF MACD Bars Indicator?
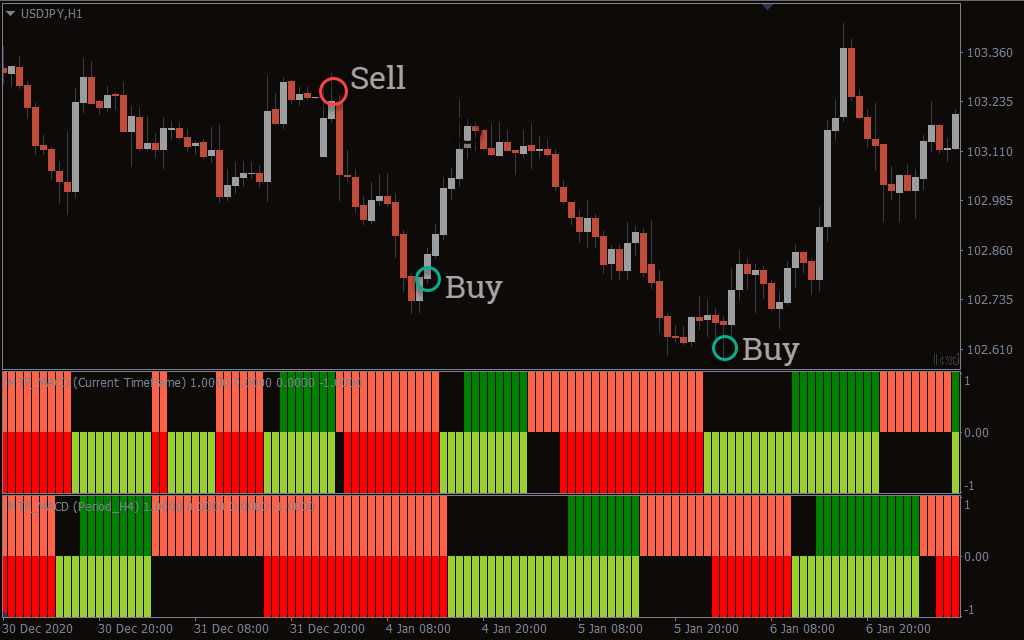
Most trend traders use higher timeframes to identify bigger trends. They use the higher timeframe chart primarily to identify the major trend. Additionally, the lower timeframe chart determines the entry point. The indicator can display MACD signals from many timeframes in the indicator window
The above NZDUSD H4 chart shows the signals generated by the indicator combining two timeframes. The indicator window shows Moving average convergence and divergence values from the current H4 chart in addition to MACD of the D1 chart. The trader can simultaneously see the daily trend and also the trend in the H4 chart.
The D1 chart trend shows the direction of the major trend, while the H4 chart provides an entry signal within the daily trend. Thereby the indicator helps the trend trader to stay in the direction of the major trend.
Setting
The MTF indicator has the same settings as the traditional Moving average convergence and divergence indicator. Besides one additional setting to choose the desired chart timeframe to calculate the Moving average convergence and divergence values.
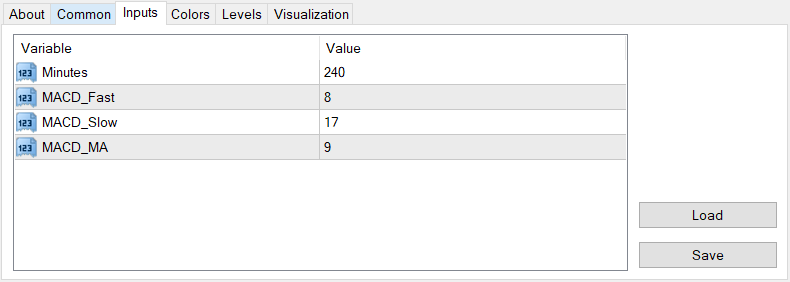
Minutes: Chart Timeframe in minutes
MACD_Fast: The value calculates the Fast MACD
MACD_Slow: Slow MACD value
MACD_MA: Moving average value in the indicator
Conclusion:
This metatrader indicator is a boon for forex traders using confirmation signals from higher time frames. The quality of the signals by using the MTF MACD Bars indicator is superior indeed. The trading results will be far better than the traditional Moving average convergence and Divergence Indicators. Due to multiple timeframe signals.