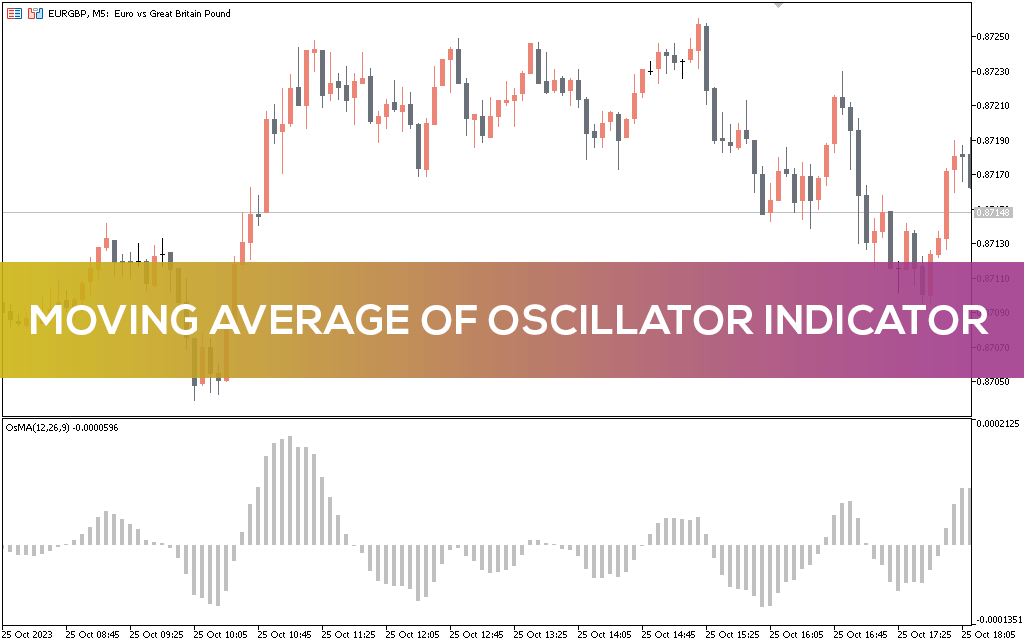
The Moving Average Of Oscillator Indicator is also commonly known as the OSMA indicator. This helps traders identify overbought and oversold conditions under which a trend reversal can occur. The indicator builds a histogram that shows the difference between an oscillator and its moving average. In other words, the indicator generates histograms showing the difference between the oscillator (MACD) and its signal line. In this article, we will explain how you can use this indicator to trade reversals in overbought and oversold markets.
You can calculate the indicator using the following equation: Moving Average Oscillator (OsMA) = MACD – signal line
MACD or moving average convergence. The divergence in the equation above is the difference between a fast 12-period exponential moving average (EMA) and a slow 26-period EMA. The signal line or 9-period SMA of the MACD is then subtracted from the MACD to get the OsMA.
How to trade with the OSMA indicator
The OSMA indicator is available on the Navigator panel in the Oscillators section. You need to select an indicator from the list of indicators available in the indicators section. After selecting an indicator, a histogram is drawn below the price chart, which provides important visual information about the price movement on the price chart.
As shown in the chart below, the price and indicator are showing a bearish divergence. This means that the price level is rising, but the indicator is starting to fall. The divergence between the price and the indicator shows that a trend reversal in the direction of the indicator is coming. So, in this case, the direction is bearish.
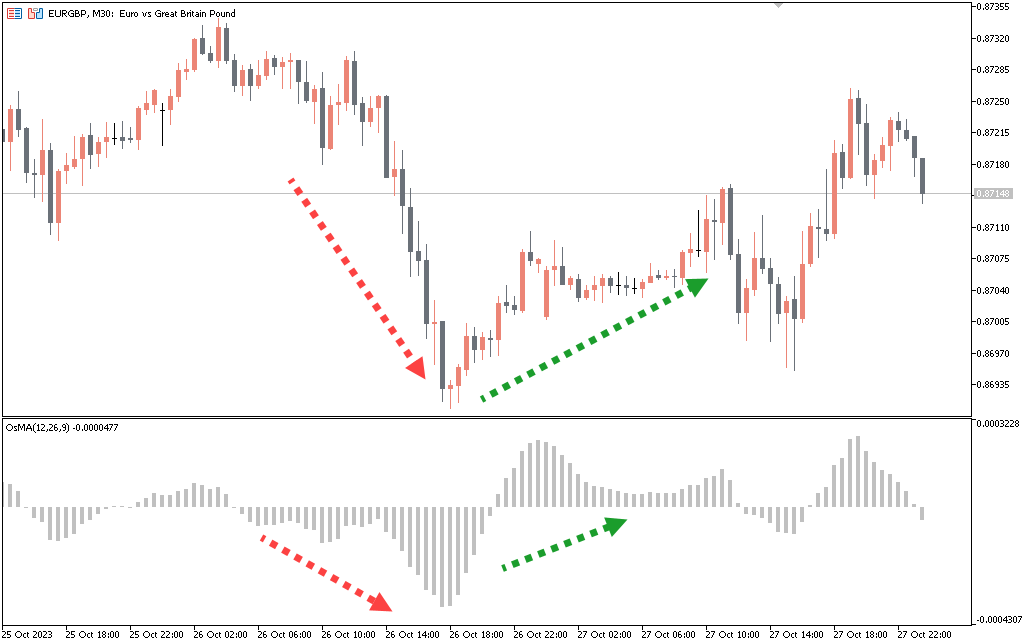
The chart above shows that the price is rising, but the indicator shows a downtrend. Soon, the price fell sharply and sharply, just as the histogram of the indicator predicted.
You need to wait until the divergence becomes apparent and the histograms get smaller and get closer to the zero line where you can enter your trade. You can exit the trade when the histogram line becomes less than the previous one or there is a rollback from the previous candle.
Setting
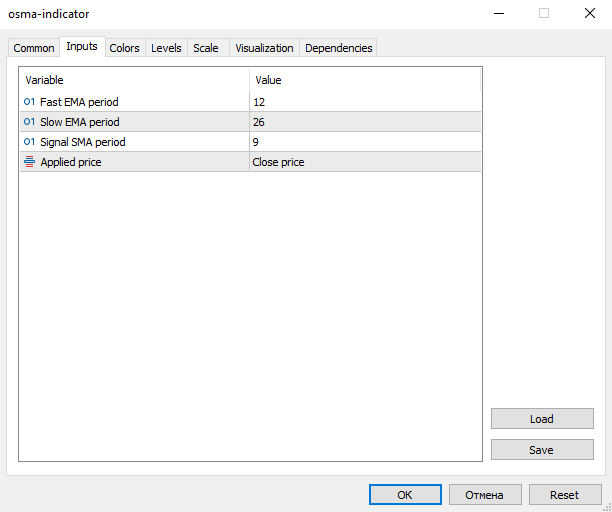
Fast EMA: The fast EMA denotes a shorter-period exponential moving average, which is set at 12 periods.
Slow EMA: The slow EMA represents a longer-period exponential moving average, which is set at 26 periods.
MACD SMA: It represents Moving Average Convergence Divergence Simple Moving Average line.
Apply to: It means that calculations are applied to closing prices.
Conclusion
The OSMA indicator is a useful tool for identifying oversold and undersold markets, as well as identifying trend reversals. You can also use it to execute numerous trading strategies. But the divergence strategy is a simple yet effective strategy that you can implement with this indicator.