Most likely, you have repeatedly seen before that it becomes difficult to distinguish the trend waves from the retracement ones due to the strong volatility in the Forex market.
To correct this problem, a free Fibonacci Retracement indicator was developed. You can check it out in this article.
Contents:
1. Description of the indicator
2. Description of the Fibonacci levels
3. How to use the indicator
1. Description of the indicator Fibonacci (Fibo) Retracement
The indicator automatically draws the Fibonacci levels (the Fibo extensions) on the MT4 chart. In doing so, it filters out the “flat market” stage and takes into account only the phases of active price movement.
The Fibo extensions help to determine possible depth of retracement (pullback) in relation to the primary trend. With the levels, you can spot those pivot points (or pivots), from which the primary trend will more likely resume.
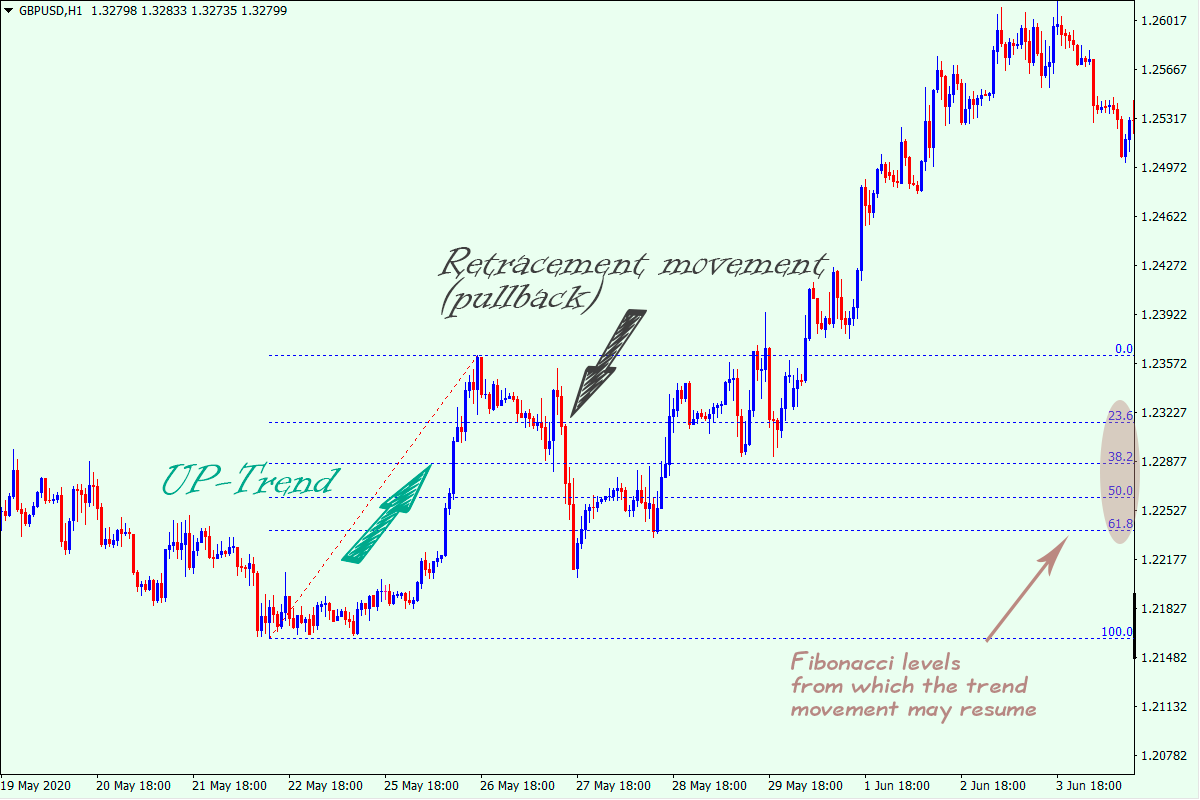
The principle behind the Fibo levels is that the deeper the pullback, the higher the chances pivot points will occur towards the prevailing trend.
2. Description of the Fibonacci levels
The Fibonacci extensions are shown as percentages and calculated as follows: set the Fibo grid (shown as the values from 0% to 100%) to display the percentage values of 23.6, 38.2, 50.0, and 61.8. The resulting values are used to draw the Fibonacci levels (they number 6):
100% – the starting point for the Fibonacci levels placement.
61.8% – the so-called “golden ratio”. This level is a good complement to the 50% value. So, if the pullback wave slows down around these two levels, it will make it more likely that a pivot point occurs.
50% – pivots often form near this level. This is due to the fact that short-term traders lock in profits on their positions after trading pullbacks.
38.2% – pivots form close to this level when traders are highly active and confident.
23.6% – pivots only rarely form near this level. Forex market participants often wait for a deeper retracement to identify entry points.
0% – this value is the ending point for the Fibo levels placement.
When using the Fibonacci levels in other indicators, you can see the 78.6% level. Usually, pullback waves don’t reach this value. This is explained by the fact that the trend movement recovers earlier, i.e. next to the higher levels. This is why the 78.6% extension level was removed from the FiboRetracement indicator.
In addition to the theoretical description of the levels, you should take into account each specific situation on the chart. So, if there has been the strong trend before the retracement, and the pullback wave is weak, there is a better chance of resuming the trend.
Conversely, if the pullbacks are stronger than the primary trend, the pullback will likely turn into a new and opposite trend.
Also, if the Fibo levels align with round-number levels (see the free RoundLevels indicator) or other technical analysis tools, the chances of recovering the primary trend will be higher.
3. How to use the indicator Fibonacci Retracement
We recommend using the Fibonacci Retracement as an addition to your trading system, as well as along with other indicators. The more signals point out that you should open a trade, the higher the odds of a positive trading outcome.
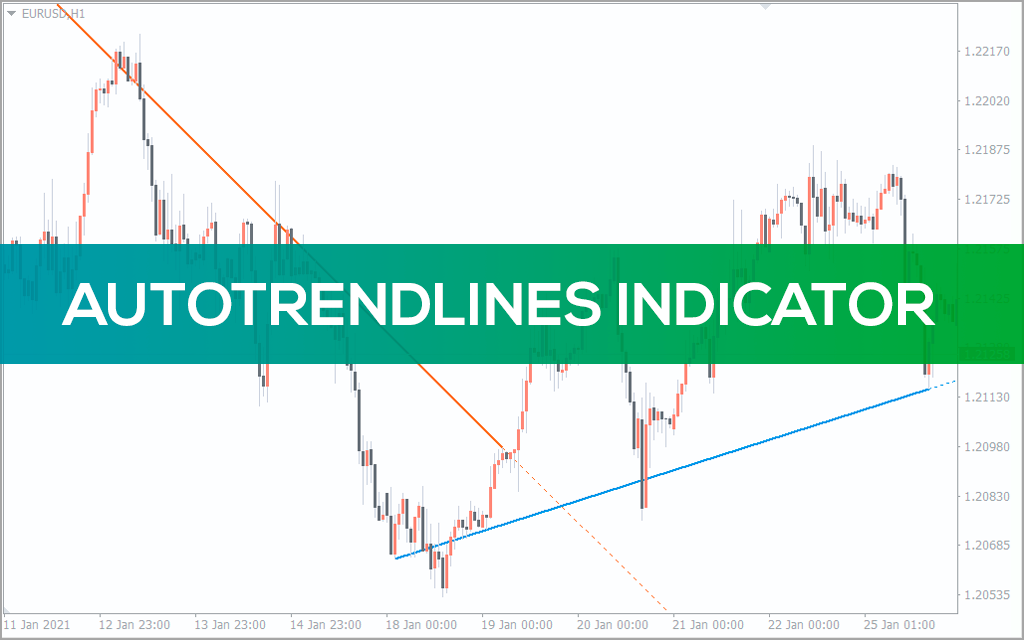
Let’s use one of the key tools of technical analysis – the trendline – as an additional trading indicator. To do this, we need to download the free AutoTrendLines indicator.
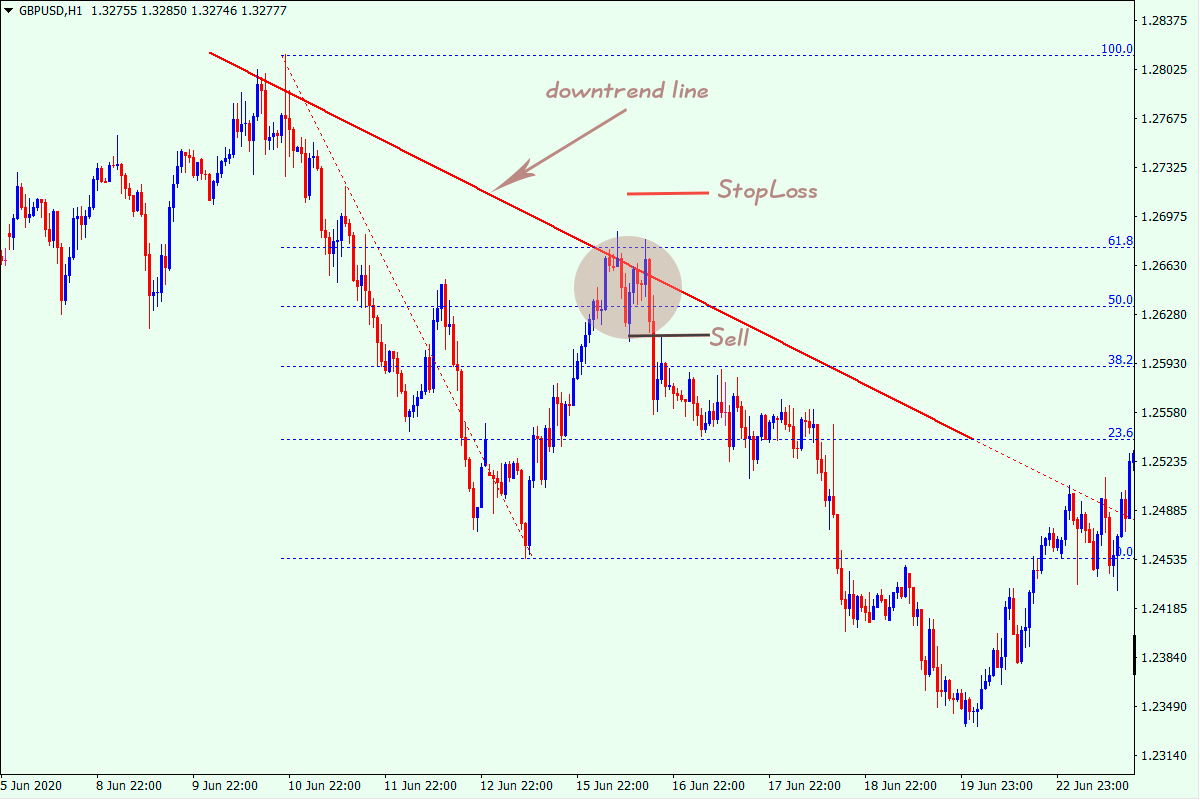
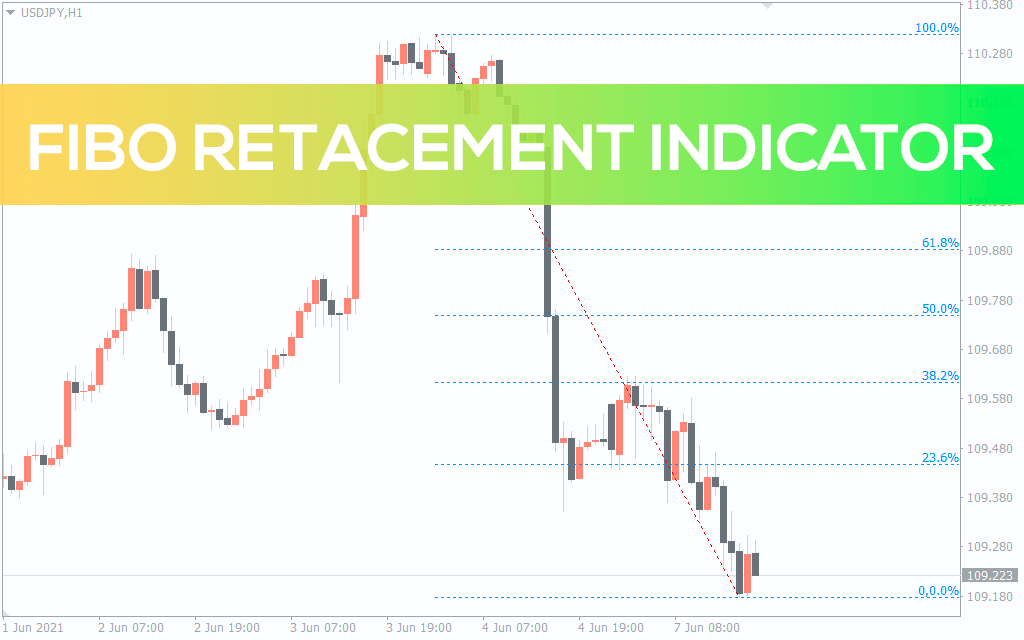
In the chart above, we can see that the pullback wave has ceased to grow near the Fibo levels of 61.8% and 50.0%. This could be the first signal of a pivot point and start of selling.
In this example, the trendline serves as a secondary indicator and indicates that the probability of resuming the downtrend near it is not so high.
It’s worth spotting the pivot points when the downward movement resumes; as for Stop Loss, it would be safer to set it beyond the trendline.
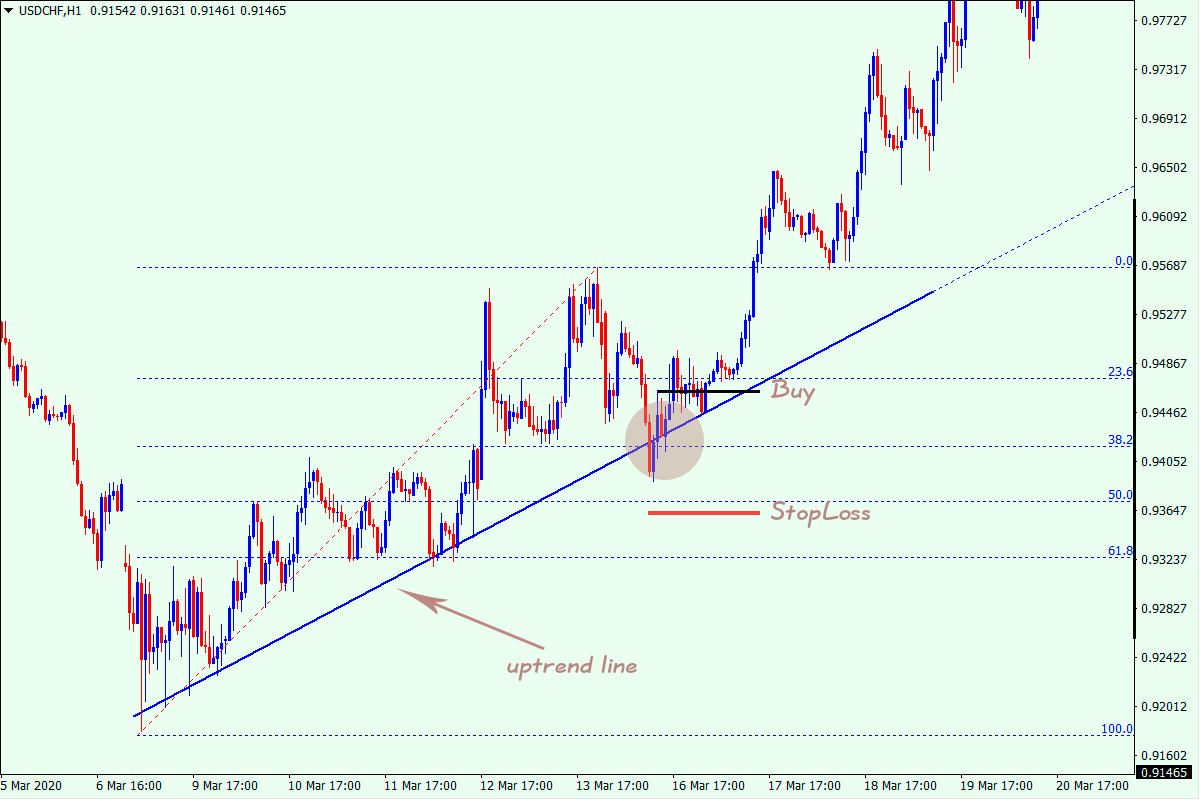
As with selling, on this chart you can see the trendline that represents an additional tool and indicates a bullish trend.
Unlike with selling, the pullback movement has reached only the 38.2% Fibo level. This suggests that Forex market participants are optimistic and actively make Buy trades.
In this case, you can open a trade at the market price, and Stop Loss should be placed beyond the support line.
When you switch from one timeframe to another, the indicator’s levels won’t be redrawn. This defect can be corrected by double-clicking the indicator and removing it. After that, the indicator will run on the timeframe you’ve selected in an automatic mode.
The major advantage of the indicator’s levels is their usefulness. Regardless of the time interval you trade on and the method you use (scalping, intraday trading or long-term trading), the indicator will be useful in spotting good pivots after pullbacks.
You can also see the overall sentiment of Forex market participants using the Fibo levels. And knowing that, you will most likely predict where the price could go next.
Setting
In the indicator’s settings, you can select the following parameters:
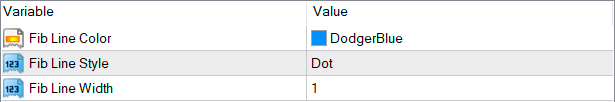
Fib Line Color – allows you to select the color of the Fibonacci levels.
Fib Line Style – enables you to select the type of the lines displaying the Fibo levels.
Fib Line Width – allows you to select the thickness of the levels.