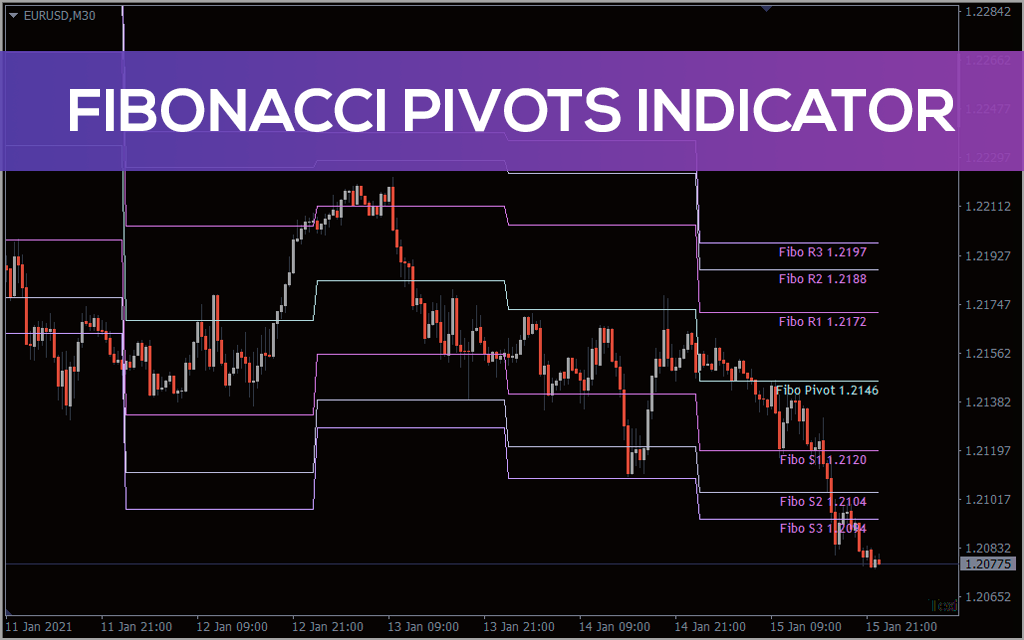
It’s of paramount importance to new and experienced traders to find the best support and resistance levels. Traders widely use pivot levels to understand the current price trends. Combining pivot levels with Fibonacci ratios enables traders to identify strong support and resistance levels. Fibonacci Pivots indicator provides stop loss and multiple take profit points. It allowing the trader to trail the markets once the trend is established.
Most traders start the day by identifying support and resistance levels and then use other indicators to validate them. The Fibonacci pivot level indicator for MT4 helps the traders find the best support and resistance levels automatically.
Identifying the potential trend for the day is another essential task. Pivot points are calculated using the previous day’s high, low, and closing values and dividing by three. If prices are below the last day’s pivot level, then the trend is deemed to be bearish. Intraday traders tend to look for bullish price action if the current price stays above the pivot level.
New and experienced traders highly appreciate Fibonacci numbers and their effectiveness in forex trading. Traders use fibo numbers are applied to the pivot point to derive the best support and resistance levels. Also in trading, market players use Fibonacci ratios of 38.2, 61.8 and 76.4 to calculate three different resistance and support levels.
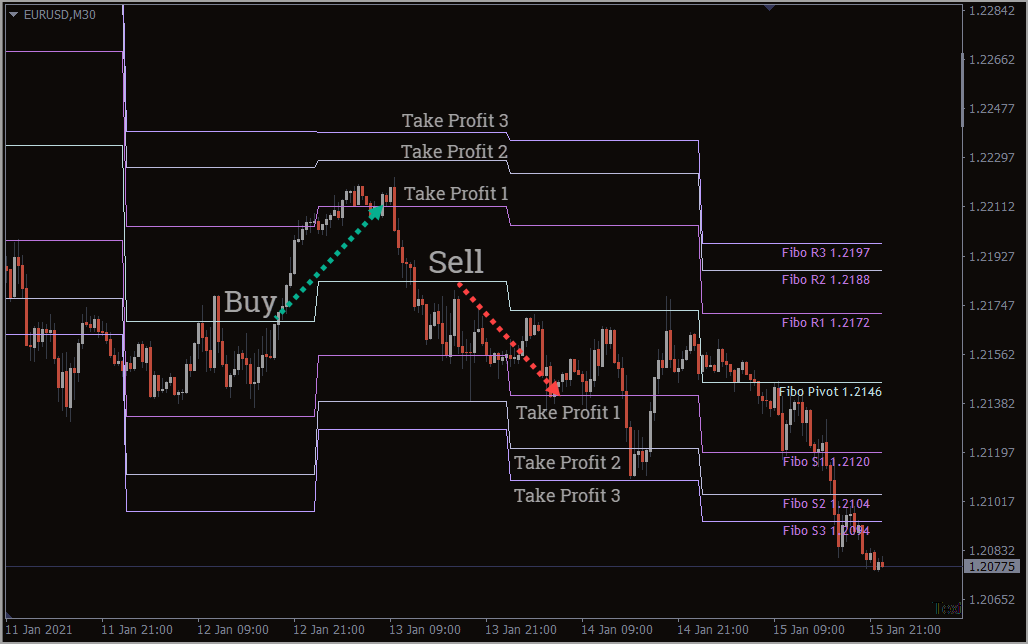
How to trade the Fibonacci Pivots indicator for Metatrader?
If the price crosses the pivot level to the upside, then a BUY position is initiated. The resistance R1, R2, and R3 form the take profit targets of profit 1, 2, and 3, respectively. Traders may look to partial book profits at these levels. A stop loss is placed below the support S1.
If the price moves to R1, the stops can be moved to break even. If the price continues to advance and hit R2, then the stop can be moved to R1 and then moved to R2 and R3 as the price moves further.
Below is the formula for calculating the pivot point and support and resistance levels:
Pivot = (Previous High+Previous Low+Previous Close)/3
Resistance 1 = Pivot +(Previous High-Previous Low)*0.382
Support 1 = Pivot-(Previous High-Previous Low)*0.382
Resistance 2 = Pivot+(Previous High-Previous Low)*0.618
Support 2 = Pivot-(Previous High-Previous Low)*0.618
Resistance 3 = Pivot+(Previous High-Previous Low)*0.764
Support 3 = Pivot-(Previous High-Previous Low)*0.764
Limitations:
Pivots are calculated using the previous day’s data, market dynamics may change and not necessarily follow the trend as indicated by Pivot. Support and resistance levels are based on Fibonacci numbers and are a mathematical value.
Setting
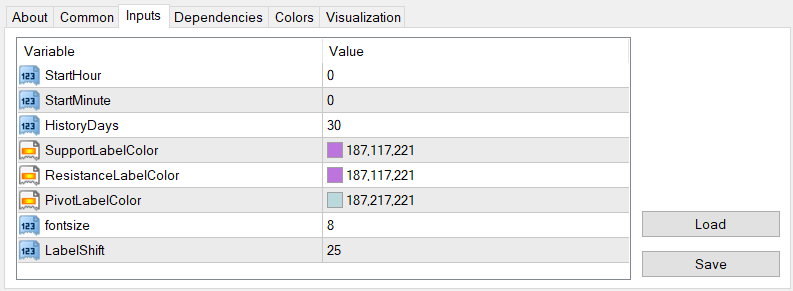
StartHour – Start of the hour of day used to calculate pivot point
StartMinute – Start of the minute of the day for pivot point calculation
HistoryDays – Number of days to draw the indicator on a chart
SupportLabelColor – Color of the text to display support price
ResistanceLabelColor – Color of the resistance value text
PivotLabelColor – Color of the pivot value text
fontsize – Changes font size of values
LabelShift – Moves the position of values
Conclusion:
Both indicators provide strength to the support and resistance; however, additional confirmation using price actions is required to trade successfully.