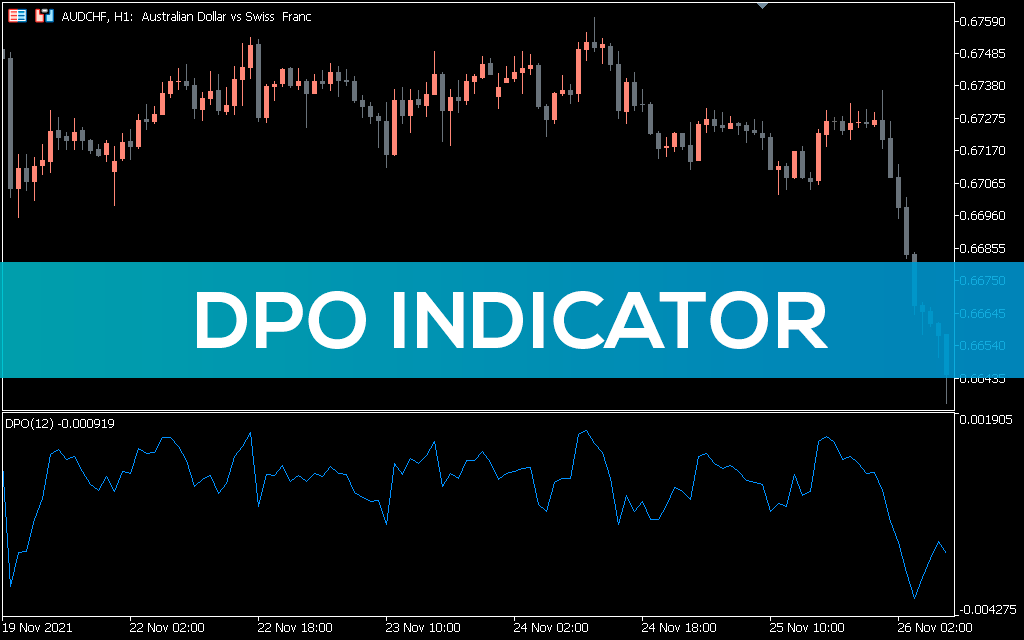
The DPO indicator is a simple indicator that indicates overbought and oversold levels on a chart. DPO, also known as a trendless price oscillator, works like any other momentum oscillator.
It fluctuates between 0 and -0 and indicates overbought and oversold zones. Traders can then go long or short positions.
The indicator works best on longer timeframes such as a weekly or monthly chart. Short-term traders can take advantage of DPOs by looking for signals on longer timeframes and then taking positions on shorter ones.
DPO Indicator BUY/SELL signals
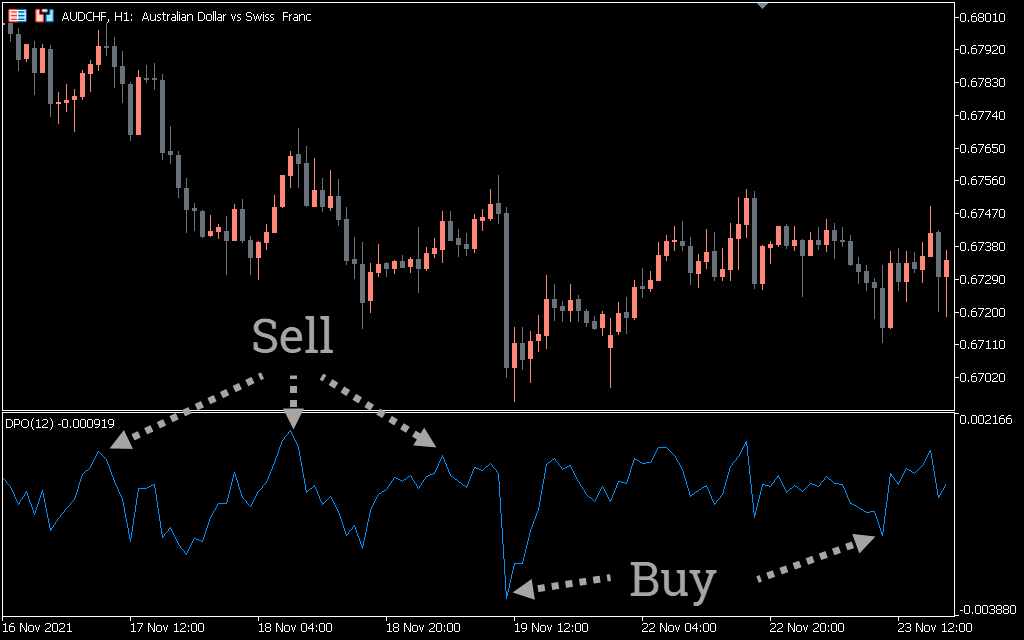
The AUD/CHF hourly chart above shows the BUY and SELL signals of the indicator. To identify BUY and SELL signals, traders must look for overbought and oversold levels. When the indicator drops to -0, it indicates an oversold condition and traders can enter long or exit short positions.
Conversely, when the DPO indicator approaches +0, it shows the currency pair at the overbought level. Here, traders can enter short or exit long positions. Sometimes the indicator does give false signals. Therefore, it is better to combine it with a moving average or any other momentum indicator such as RSI or MACD.
Setting
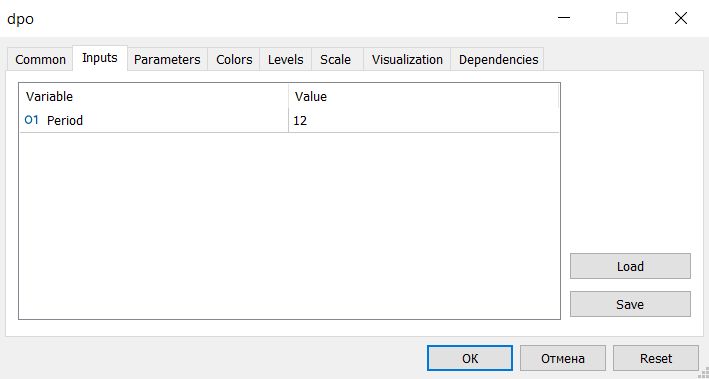
Period: The default value is 14. It mentions the period of the indicator.
Conclusion
The DPO indicator is a momentum oscillator that reports overbought and oversold conditions. Traders can find exact entry and exit points using these levels. In addition, you can download the indicator for free from our website.