Double Top Trading Pattern – What Is It & How Does It Work?
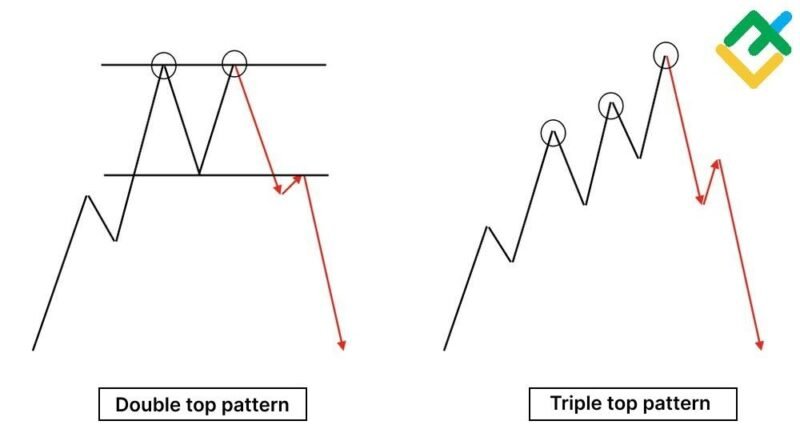
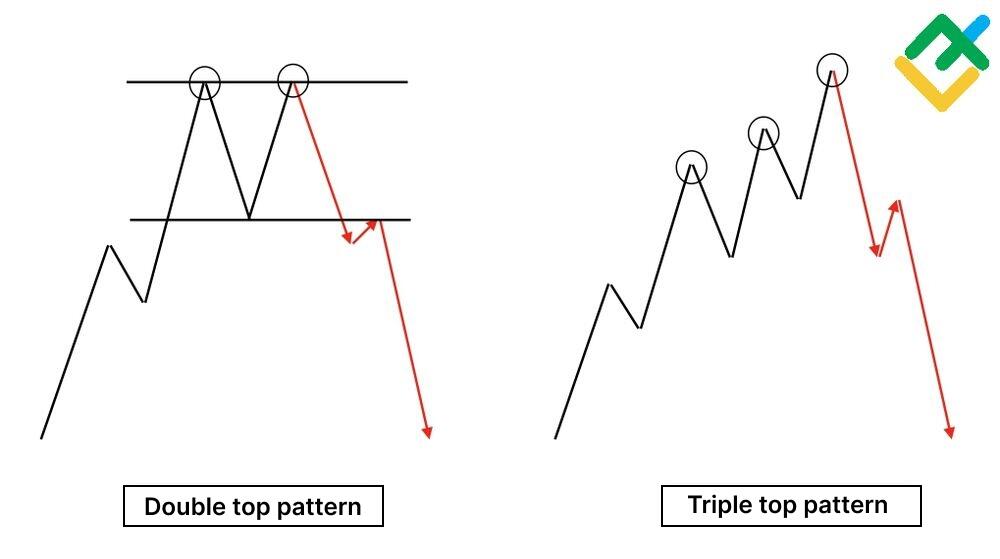
Each trader observed in the chart a figure in the form of the letter M called double top. The distinctive feature of this pattern is that the quotes reach the horizontal resistance level twice. Additionally, a trough is formed between the two peaks as a short downward correction.
But why is the price moving this way? What does the pattern warn about? How often can this pattern be found on a candlestick chart? In this article, you will learn what a double top is and how to trade profitably using this pattern in Forex.
What Is a Double Top?
The double top pattern indicates a bearish reversal and warns traders about a possible trend reversal down at the top. This pattern is often found in the Forex market, as well as in the cryptocurrency, stock, and commodity markets. The double top is used by traders for both intraday and long-term trading.
The double bottom signals a bullish reversal. A double bottom chart forms at the bottom after a downtrend. This pattern warns traders about a possible trend reversal up.
The double top pattern signals that the asset is overvalued. This is also indicated by a price increase with little or no correction. After a strong uptrend, the pattern forms two highs at the same resistance level. In some cases, the second high may be slightly higher than the first. At the same time, an intermediate downward correction can be seen between the two tops, which makes the pattern look like the letter M.
After the formation of two tops, the asset quote finally reverses down, forming the beginning of a downtrend. If the price reaches the support line, then the further downtrend will intensify. However, there are situations when buyers manage to hold the support level, and the price goes up, which means there are false breakouts of support. In this case, the probability of a triple top pattern with the formation of the third price high increases. This pattern is also called three mountains. This pattern’s highs can be placed at the same level or in growing order. The three mountains pattern is formed much less frequently on candlestick charts.
Double Top Pattern Formation
The double top pattern can occur on different timeframes. The larger the timeframe, the stronger the bearish signal for a trend reversal.
The double top formation consists of five main stages:
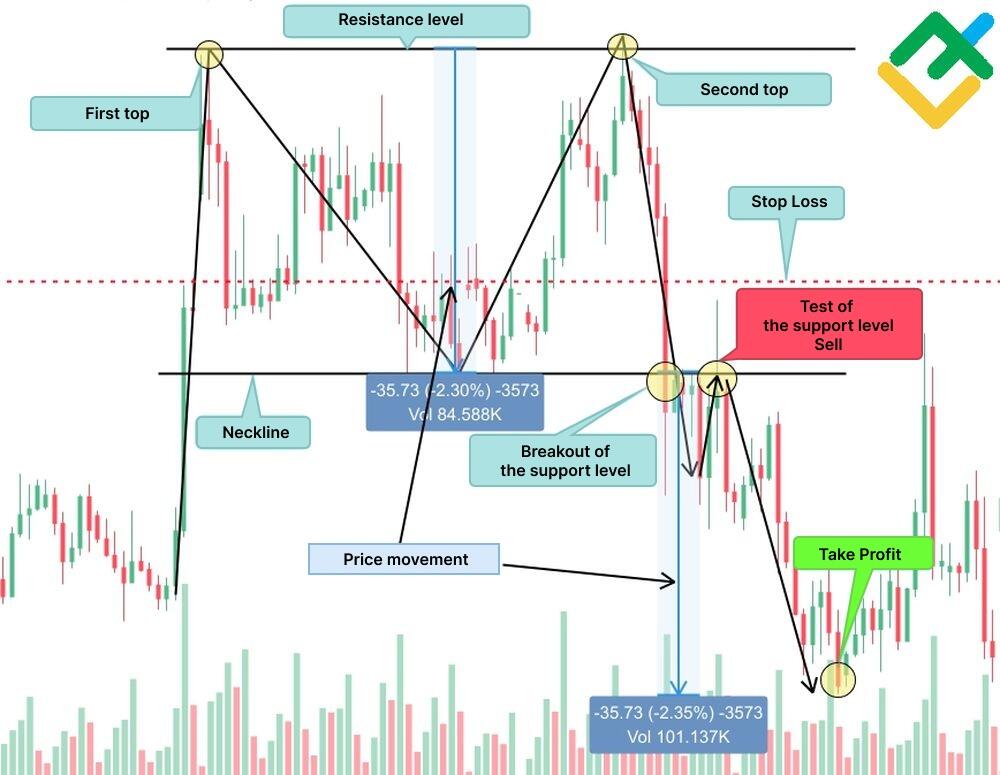
- The formation of the first peak in the chart. At this stage, there is a prevailing buying trend while the price reaches a local or new resistance point.
- Price correction to the nearest support level. Support, in this case, is called the neckline.
- Formation of the second top. At this stage, despite the selling pressure, the bulls again raise the price to the first top level.
- Final bearish price reversal. After another attempt by buyers to break out the resistance, the bears begin to actively reduce the price to the nearest support level.
- A breakout of the support level signals a trend reversal. Short trades can be opened.

How to Spot a Double Top Pattern?
The double top consists of three key elements, which are formed in the chart in the form of the letter M:
- first top;
- trough;
- second top.
Let’s analyze the four stages of the double top formation:
1. First top formation.
First, the price rises continuously (the first high is being formed). Trading volumes are increasing.
2. Trough formation.
After reaching a high, the price corrects downward, forming an intermediate support line, the so-called neckline. At this point, there is uncertainty in the market. The influence of bulls and bears is equal.
3. Second top formation.
The price reaches the local support level, while the bulls are trying to take the initiative and drive the price up. As prices rise, trading volumes decrease. However, as soon as quotes reach the first top level, short trades are massively opened in the market. The price starts to decline, and the trading volumes increase.
4. Breakout of the neckline of the pattern.
The price continues to fall, reaches the local support and breaks it out. As a rule, quotes should test the broken out level and continue the decline. However, the price can also decline without a correction, maintaining the current trend. The breakout of the neckline is a signal to open short trades.

What Does A Double Top Tell Traders?
A double top is a reversal pattern that is formed at price highs and warns of a downward trend reversal. The pattern formation allows traders to enter profitable short trades. You can calculate the entry points to the trade in advance according to the pattern and set stop loss and take profit.
Let’s analyze the pattern in more detail using XAUUSD as an example. The H4 chart shows the double top formation. After the formation of the first top, the price began to decline. As a result, a local support level was formed. Then the bulls opened long trades, and the price rose again.
However, as soon as the quotes reached resistance, the price declined rapidly and overcame the neckline. In the future, quotes will test the broken out support level and continue to decline.
According to the double top pattern trading rules, short trades should be opened after a test of broken out support. The profit target is determined by the distance from the tops to the neckline, that is, traders can immediately determine the further movement. However, when important news is published, and in other cases, quotes drop even lower. Stop-loss, according to the risk management rules, is set above the broken out support level.
How to Trade Double Top
When trading using the double top pattern, it is important to stick to the following rules:
- First of all, you need to define the pattern itself. It occurs at the top of an uptrend.
- It is important to wait for the formation of two tops and roughly indicate the resistance level. Tops should be placed at approximately the same level.
- After the formation of the second top, it is important to wait for the final price reversal.
- It is necessary to open short trades after fixing the price below the intermediate support, that is, the trough.
Let’s analyze trading according to the double top pattern using the EUR/CAD currency pair as an example.
The double top pattern is formed on the H4 chart. Both local highs are approximately at the same level, that is, the bulls will not rise above 1.5093. The chart also shows the neckline at 1.4847. At this level, the price reversed up.
Further, the bears overcame the local support level, and the price continued to decline. I should have entered a short trade after the first red candle closed below the support level. However, I didn’t find the chart right away and opened a 0.01 lot short position a little lower, at 1.4736. Potential profit is at the level of 1.4609. Stop-loss is set above the neckline at 1.4877.
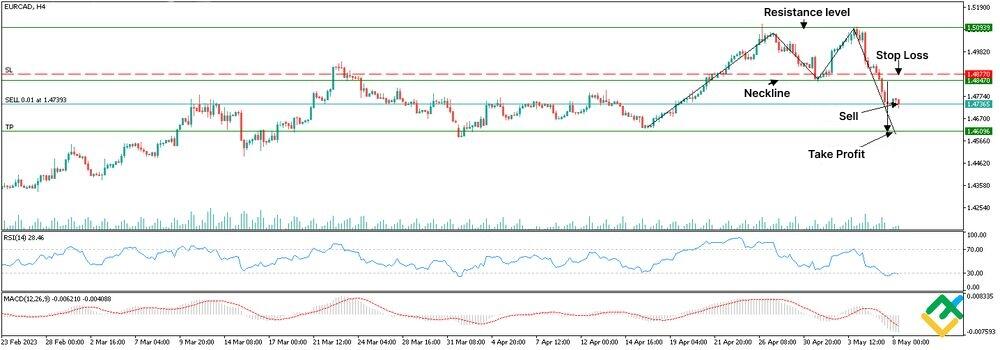
After the opening of trade, the price, as expected, continued to decline. Two days later, the trade was closed manually with a profit of $4.44 (more than 40% of the profit of the trade volume).
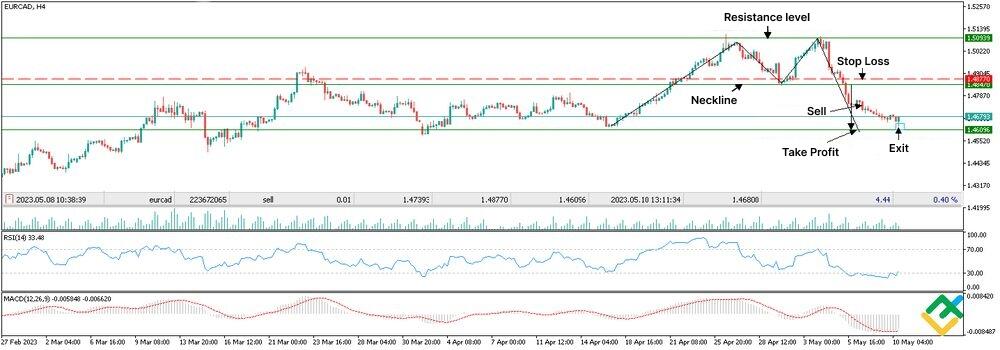
Double Top Example
The double top pattern is quite simple. It is often found in various financial markets. Below are double top examples in the charts of popular assets.
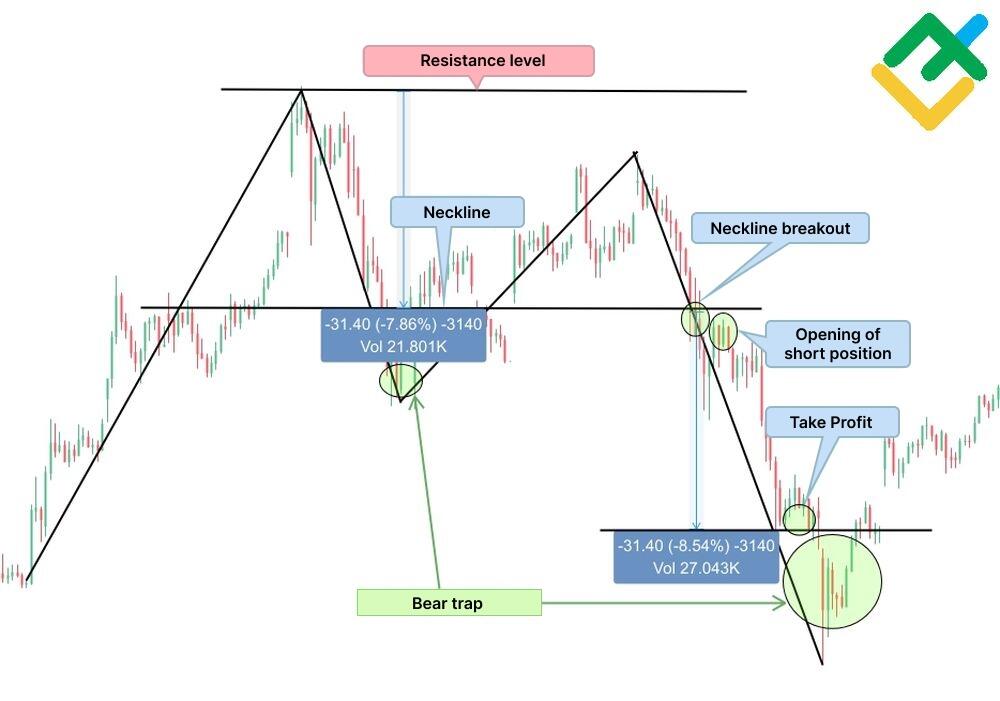
Double top in Tesla chart
A double top is formed after an uptrend in the M30 chart. The bears managed to reverse the price down after the second local high and break out the support level.
Pay attention to the bear traps in the chart. When trading double tops, you need to be vigilant not to use false signals.
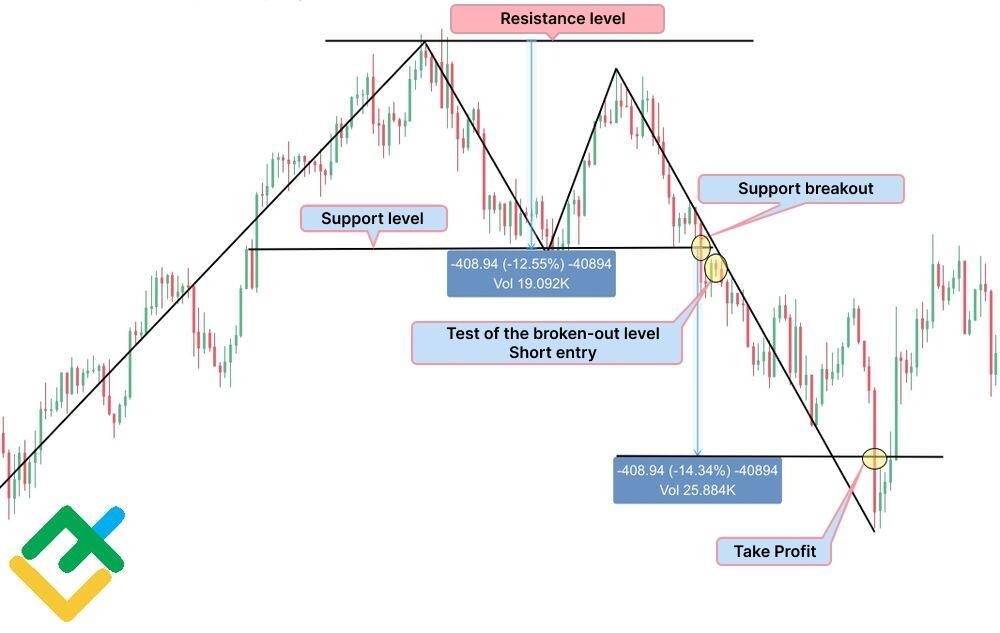
Double top in ETHUSD chart
A double top is developing in the H4 ETHUSD chart. After the buyers tried to return the quotes to the first local high, the sellers became more active in the market. The price reversed and broke out the support level. This led to a massive opening of short trades.
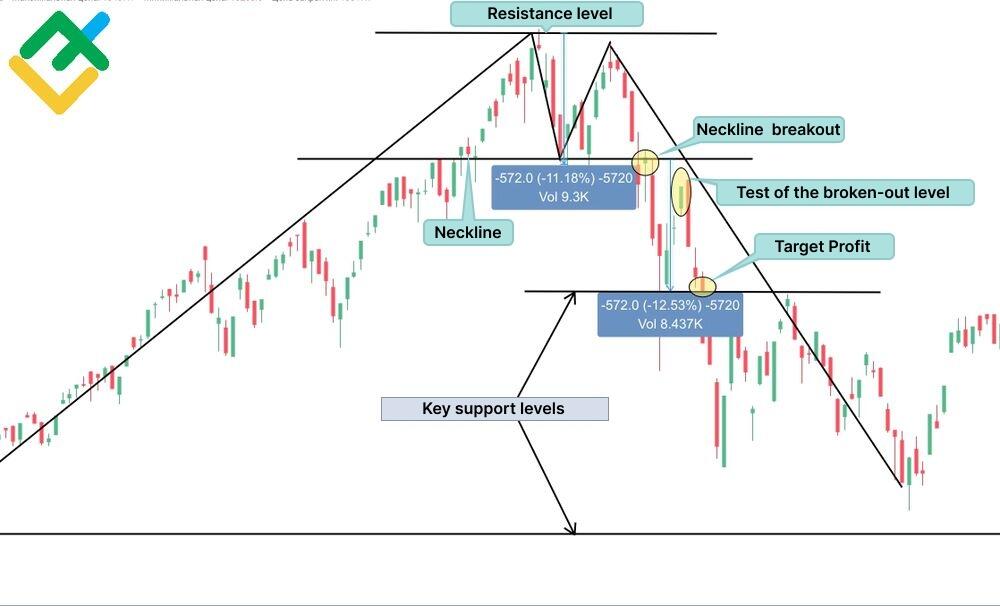
Double top in NASDAQ100 chart
A double top occurred in the chart before the big sell-off in the US stock market in 2000. As you can see below, the instrument’s quotes fell even lower than the expected target. In this case, entering trades with partial profit-taking was possible when key support levels were reached.
Limitations of Using The Double Top
As with trading other patterns, Double Top trading has its limitations. When forming a pattern, traders often fall into bear and bull traps. As a result, positions are automatically closed, which leads to further price reversals.
It is very important that all the criteria for constructing a pattern in the chart are met. Especially when opening short trades after the breakout of support at its lowest point. Otherwise, you risk losing funds.
When trading double top pattern, it is important to follow the risk management rules and spend no more than 2% of the total deposit per position. It is also important to confirm the double top with other chart patterns and indicators. Using additional technical analysis instruments, traders can get a complete picture of the market and more accurately predict further price movements.
Conclusion
The double top chart pattern is one of the key top reversal patterns. The pattern signals that the asset price has reached a key resistance level, above which buyers cannot move. The double top can be found in almost any financial market and timeframe, which allows traders to actively use this pattern.


