Unfortunately, the MT4 terminal doesn’t have an indicator that can analyze the strengths (or power) of currencies in relation to each other. To correct this problem, a free Currency Strength Meter was developed. In this article, we’ll introduce you to the indicator.
Contents:
- Description
- Features
- How to use
- Conclusions
1. Description
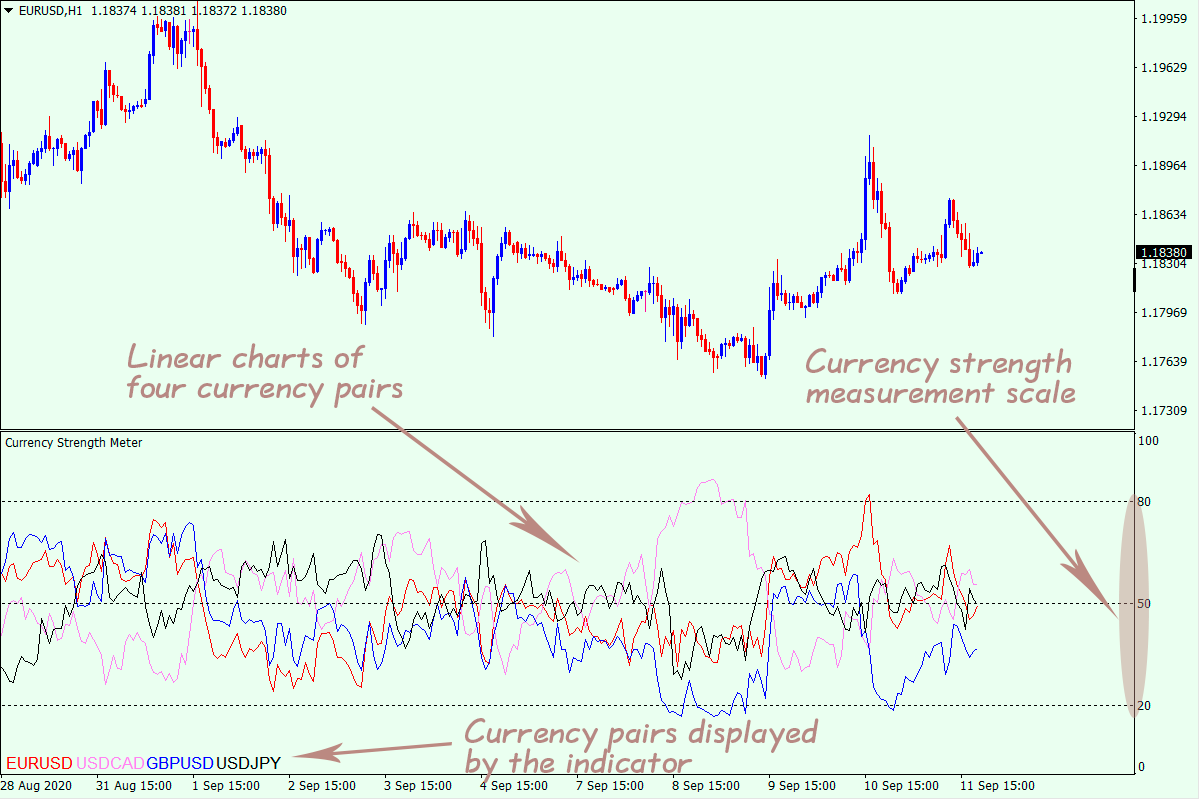
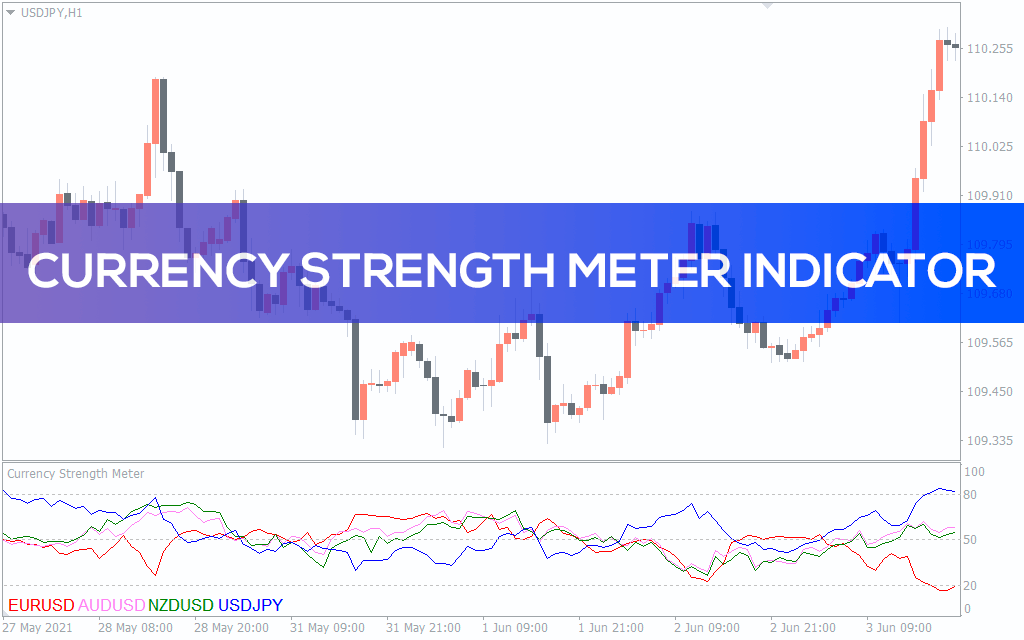
The CurrencyStrengthMeter indicator (i.e. currency strength meter or metre) constructs 4 charts of currency pairs in live mode and displays the strengths of currencies in relation to each other. Ticker symbols of financial instruments are displayed in the lower-left corner of the indicator’s window. Colors of the symbols match the color of the chart in the indicator’s window. Currency strength measurement scale is drawn up vertically and contains the values from 0 to 100.
The base currency is the one that is quoted first in a currency pair, while the quote currency is the one that is quoted second. Using EUR/USD as an example, the EUR would be the base currency, and the USD would be the quote currency.
The closer the chart gets to 100, the stronger the base currency and the weaker the quote currency (upward trend). When it happens, it makes sense to take into account the big picture of the market. So, if the indicator signals an upward trend, but the rising price movement is weak and unimpressive, it’s best to wait for more reliable buying conditions.
The same is true of the reverse situation: the closer the chart gets to 0, the stronger the quote currency and the weaker the base currency (downward trend).
Charts, which are close to 50, indicate that the strengths of currencies are roughly equal and there is no clear trend.
2. Features Currency Strength Meter
When analyzing the strengths of currencies, the term “correlation” is usually used. Unfortunately, the Metatrader 4 terminal doesn’t have an indicator that can compute the value of this parameter.
Correlation (dependence) is a coefficient reflecting the strength of unidirectional or multidirectional movement of currencies. It can be inverse (different directions of trends) and direct (similar directions of trends).
The given parameter is often published online on the top financial websites. However, with the currency strength measurement scale built in the CurrencyStrengthMeter, you can monitor this dependence directly in the indicator’s window.

As in the above example, the charts of currency pairs are inversely correlated – it’s indicated by the fact that they’re near the values of 20 and 80 on the currency strength measurement scale.
As for the third case, both currency pairs are of the same direction that suggests a direct correlation.
Thus, using the CurrncyStrengthMeter indicator, you can find out in real time, which currency is most in demand among FX market participants, and use it to develop your own trading strategy.
3. How to use Currency Strength Meter
The indicator doesn’t generate signals to open trades, but it provides a common understanding of market positioning for the analyzed currency pairs.
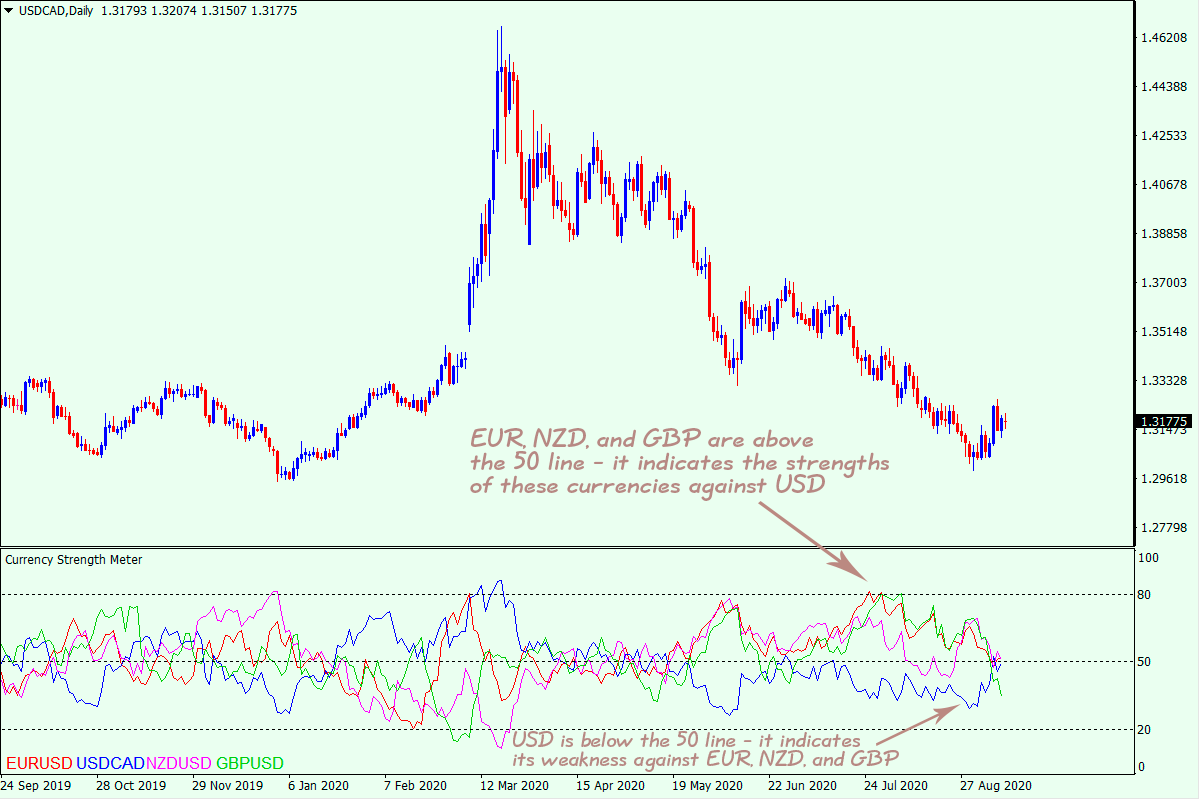
In this example, we can see that EUR/USD, GBP/USD, and NZD/USD currency pairs are above the 50 level. This tells us about the strengths of EUR, GBP, and NZD against USD.
The chart of USD/CAD, which is moving in parallel to the above pairs, is below the 50 level – it suggests that USD is weak against CAD.
Therefore, by comparing all the above-mentioned currency pairs, we can conclude that USD is weak against every other currency. With this conclusion in mind, you can plan your Forex trading more efficiently.
When using this digital product, the priority of timeframes should be remembered. The chances of making profitable trades are higher on high timeframes. It does so by reducing the market noise. However, in theory, there will be fewer entry points on this timeframe.
On the contrary, there may be more entry points on a lower timeframe, but the quality of trading signals may be harmed due to the high volatility.
4. Conclusions
At first sight, it may seem to you that the simultaneous use of four charts at once is too complicated.
You can eliminate this minor disadvantage in two ways: choose fewer charts to be constructed or change their visualization (thickness and style of lines).
After all, when you customize and check out the indicator, you’ll more likely get used to it soon and be able to easily see the practical benefits of using it in your trading system.
Setting
The indicator’s settings have the following parameters:
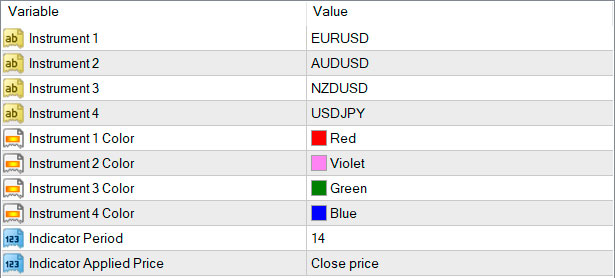
Instrument 1 – allows you to select the first currency pair to be displayed;
Instrument 2 – enables you to specify the second currency pair to be displayed;
Instrument 3 – allows you to select the third currency pair to be displayed;
Instrument 4 – enables you to specify the fourth currency pair to be displayed;
Instrument 1 Color – allows you to select the color of the first currency pair’s chart;
Instrument 2 Color – enables you to select the color of the second currency pair’s chart;
Instrument 3 Color – allows you to select the color of the third currency pair’s chart;
Instrument 4 Color – enables you to select the color of the fourth currency pair’s chart;
Indicator Period – allows you to select the period of the indicator;
Indicator Applied Price – allows you to specify which type of price to apply the indicator.