There usually comes a time in the journey of a forex trader when they are not only concerned with market trends, but also the volume behind those trends. Because knowing how much volume there is behind every trend helps to filter out minor trends from major trends. This knowledge has driven many professional forex traders to turn to the average true range (ATR) value indicator. This volatility determining indicator has then become an indispensable tool for such tasks on the MT4 and other trading platforms.
The indicator we will look at is a simplified analogue of the ATR indicator, which is already installed by default in the MT4 Terminal. But it has a number of advantages, which we will tell in the article.
The Average True Range Value Indicator On MT4
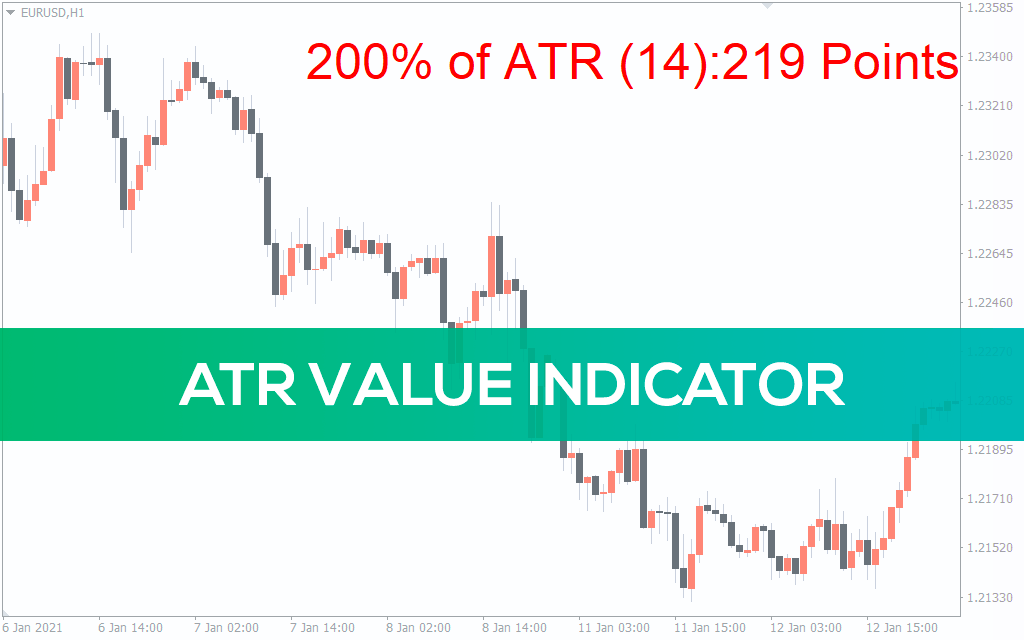
The average true range (ATR) indicator determines the volatility of the market. In other words, it portrays the average size of price movements for a given asset over a period. When you use the average true range on MT4, it displays as a line that goes up and down the indicator window. The higher the ATR value, the more volatile the market is. And the lower the ATR value, the less volume there is in the market.
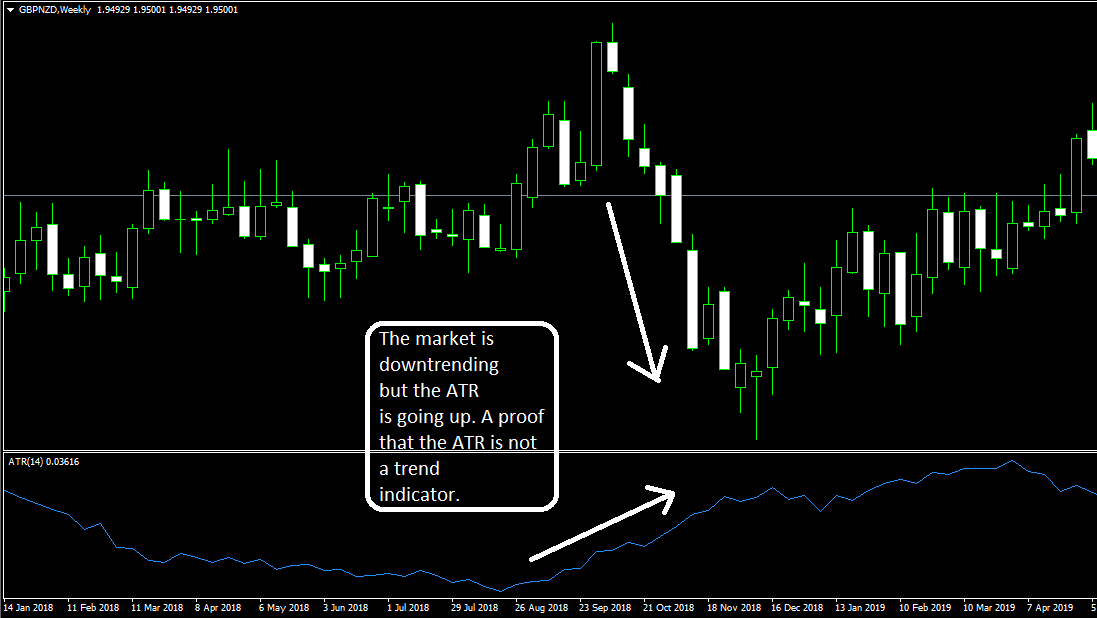
A mistake many traders make is that they try to trade trends with the ATR. Unfortunately, they might as well be trying to fit square pegs in round holes. The ATR indicator does not tell the trend of the market. There are even times, as in the image below, when the market is trending in one direction but the ATR slopes in the opposite direction.
If you are then wondering what the ATR is used for, here are some common uses of the ATR indicator.
- A trader can use the ATR value indicator to determine the best time to enter trades. The ATR can help you determine if there is enough volume in the market for you to trade. It also keeps you out of dead or inactive markets.
- You can also use the ATR indicator to determine stop loss positions.
- There are also ways to use the ATR as an exit indicator.
How Is Indicator Calculated?
As the name implies, the average true range is the average of the price range values of an asset over a period. But there are three different ways to calculate the true range of an asset.
- Subtract the previous low from the current high
- Subtract the previous close from the current low
- Subtract the current low from the current high
The ATR calculates those true ranges and uses the greatest among them as the true range for that period. Note that the ATR does not take the positivity or negativity of the number into consideration. Negative 56 (-56) is the same as positive 56 (+56) as far as the volume telling indicator is concerned.
Now that the formula for the true range for each period is known, the ATR just averages these values over a given period. The default ATR period on Metatrader 4 trading platform, for example, is 14. So, the ATR calculates the true ranges over the last 14 candlesticks and uses the values to construct a continuous line.
How To Trade With The Average True Range Indicator?
This is the part that interests many traders, and for the right reasons. What’s most important is how to implement the ATR indicator in your trading.
Here are some average true range indicator trading strategies:
● Explosive Breakouts
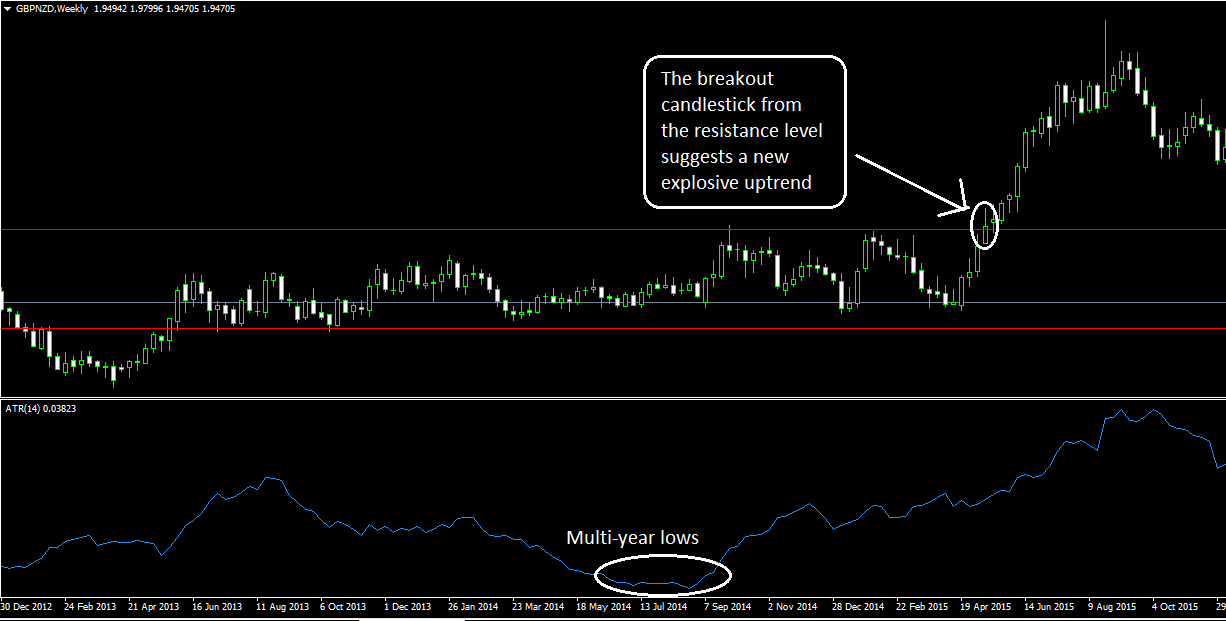
There are times when the market is very volatile, and other times when it isn’t. You can use this ATR trading strategy to take advantage of breakouts from low to volatility periods.
First, you pull up your ATR indicator on the weekly chart and wait for the indicator to hit multi-year lows. In other words, you wait till the market is at its least volatile and the ATR line is closest to the floor. Then you locate the support and resistance levels within this period on your charts and wait for a breakout to occur.
You can rely on the FXSSI support and resistance indicator to help you locate the major support and resistance levels on your chart.
● Setting stop losses
Have you ever watched the market come all the way down to hit your stop loss before immediately bouncing back in the direction you initially thought it would go? This ATR value indicator trading strategy can come in handy to prevent such happenings in the future.
Check the current value of the ATR as you enter a trade. Multiply this current value with a multiple. The most commonly used multiples are 1.5, 2, and 3. Next, you add (for a sell trade) or subtract (for a buy trade) the calculated value to the current price to make your stop loss.
You can also adapt this trading strategy to help you get the best out of trending markets. At the end of each period or candlestick, you trail your stop loss by the calculated value.
By the way, you can learn how to trade without a stop loss if you want to completely eradicate the stop loss from your trading.
● Take Profits
Since the ATR tells the average price movement for an asset for a preset number of periods, you can set your take profits with this knowledge.
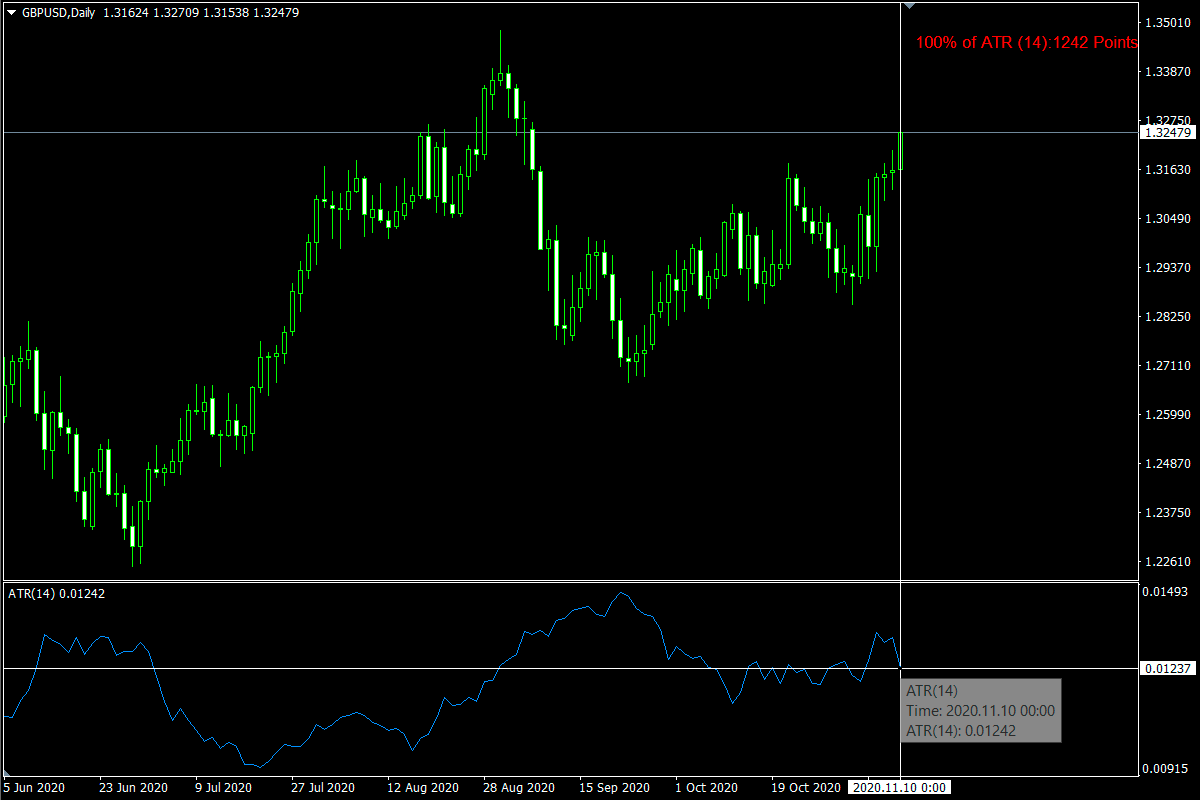
For example, if the GBPNZD daily chart has a current ATR value of 140, this tells you that the currency pair moves about 140 pips on average. So, you can place your take profit anywhere near 140 pips away from your entry price. It always works better to combine this strategy with other market structures, such as swing highs and lows, support and resistance levels, and others.
Of course, these are only a few ATR trading strategies. You could come up with better ways to use it in your own trading on your MT4.
Setting
These are the default settings that come with the atr value indicator on the MT4.
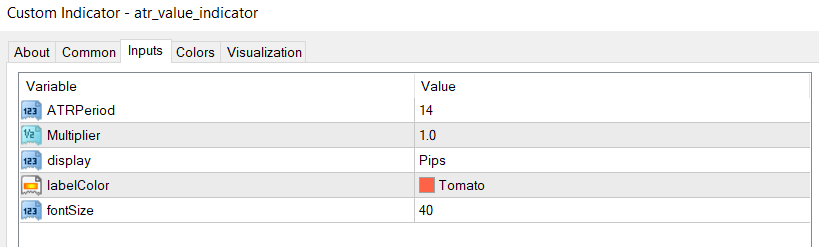
● ATR Period
This is the period or number of candlesticks that the ATR calculates its values by. The default setting is 14. And on a daily chart, this signifies that the ATR is calculating the average of true ranges over the past 14 days.
● Multiplier
Multiplies the original value of the ATR by the set multiplayer.
● Display
This allows you to display the ATR values in points or pips on the MT4. A pip is one-tenth of a point.
● LabelColor
Allows you to choose the color you want your characters to be displayed in.
● Font
You may set the size of the characters with these settings.
Who Is Indicator Best For?
The ATR is best for forex traders of all experience levels since it doesn’t tell trends. Also, the indicator can fit into the trading systems of anyone, irrespective of their trading style.
As we can see, the indicator is no worse than the standard, but even better. Because it saves space for the workspace for objective analysis of the price chart.