The Accumulative Swing Index (ASI) is used to assess the long-term trend and potential price reversals of a currency pair.
It was developed by Welles Wilder as a modification of his swing index. ASI combines price, time, and volume to produce a single value that reflects the strength of the underlying trend.
Unlike other indicators that rely solely on closing prices, the indicator takes into account the opening, closing, high and low prices of candlestick charts.
It calculates the swing index for each period by comparing the closing price of the current period with the closing price of the previous period and includes the price movement within the specified range.
How to use the ASI Indicator for MT5?
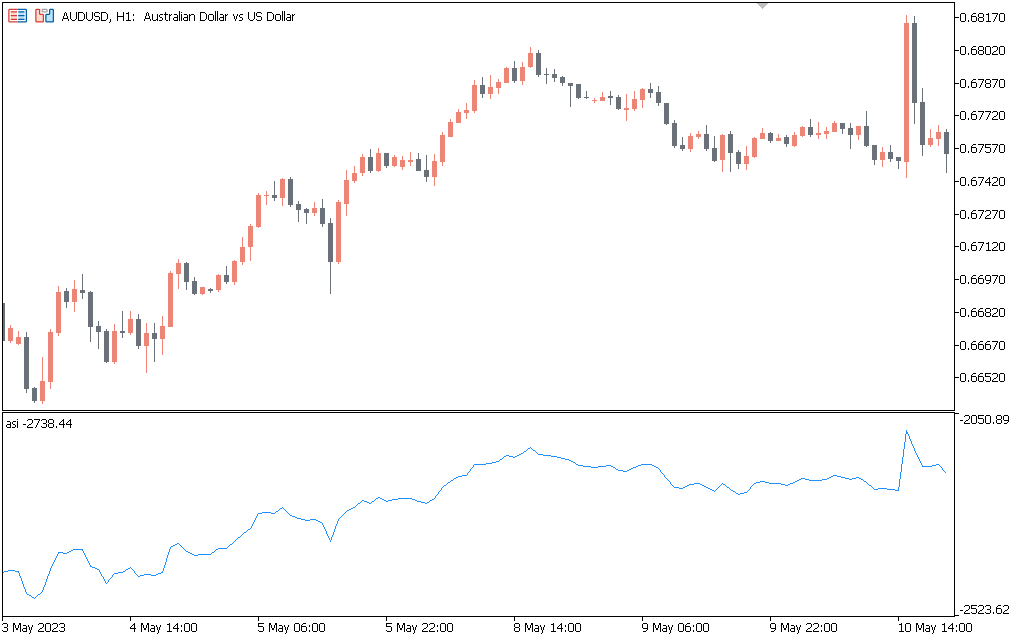
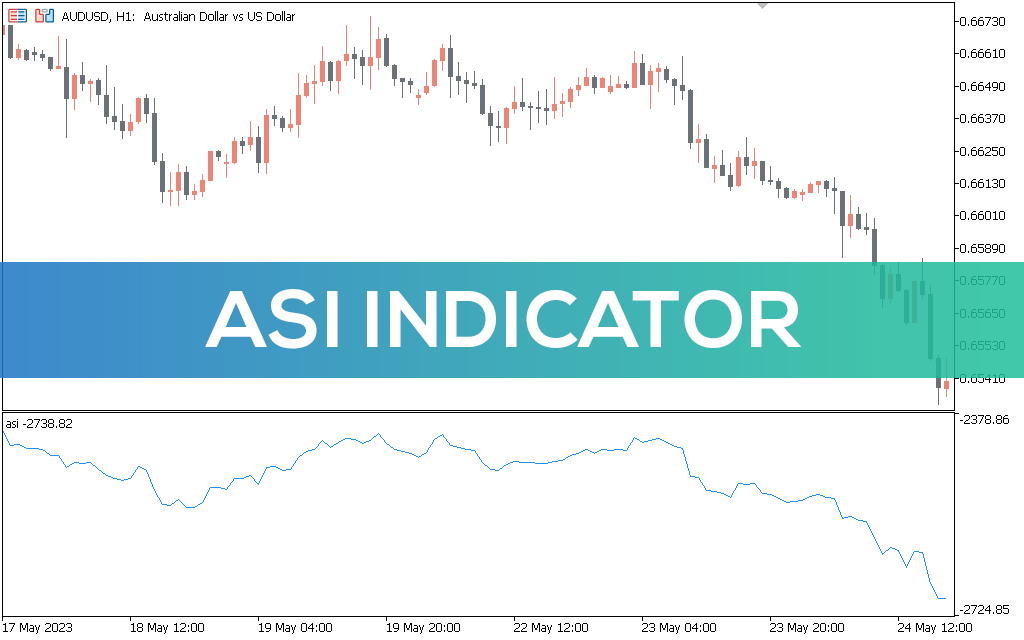
The AUDUSD H1 chart above shows the indicator. You can use this indicator to identify potential trend reversals, confirm trend strength, and generate trading signals. An increase in ASI indicates a positive trend, while a decrease in ASI indicates a weakening trend.
ASI also includes a ranking concept that helps identify periods of consolidation or fluctuations in the market. When the current close is within a certain percentage of the previous close, the indicator decrements the value assigned to that period.
It is important to note that this indicator can give false signals, so it is better to combine it with other technical tools to reduce the number of false signals.
Setting
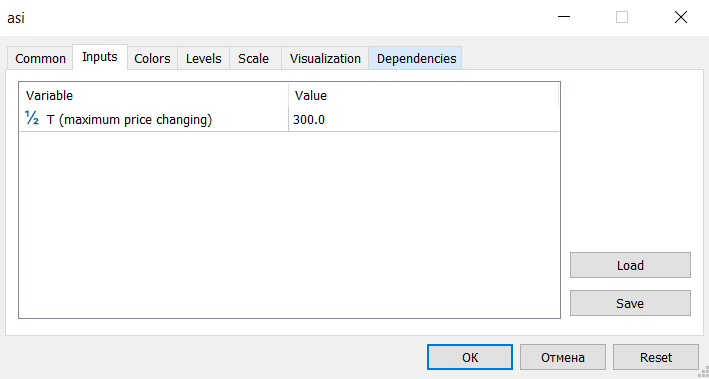
T: The default value is 300. The maximum price changing.
Conclusion
The ASI indicator for the MT5 is a modified version of the welder’s oscillation index. By considering price movement within a given range and using the concept of ranking, the indicator filters out noise and focuses on significant price movements.